0
$\begingroup$

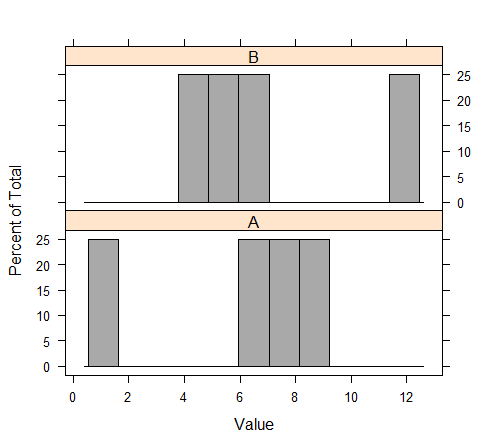
Suppose we have the following data in the Phase III study. numeric value of endpoint (n) Arm A: 1 (100), 7(100), 8(100), 9(100) Arm B: 4 (100), 5(100), 6(100),12(100)

arm N Min median mean max variance
A 400 1.0000000 7.5000000 6.2500000 9.0000000 9.7117794
B 400 4.0000000 5.5000000 6.7500000 12.0000000 9.7117794

Mean A < B Median A > B

A, B are not normally distributed, so the Wilcoxon Mann Whitney test was applied, assuming location-shift assumption. (variance is the same between two arms)

the WMW test P=0.0021 (t approximation) A > B

If t-test were used, P-value would be 0.0235 A < B (t-test , Welch-test)

1) Is location shift assumption reasonable? 2) If location shift assumption is not reasonable, the WMW-test is not the test for median or mean. Can t-test be used because sample size seems be fairly large?

$\endgroup$
0

2 Answers 2

0
$\begingroup$

The data look like the dependent variable are counts. They are certainly positive integers.

So, you could use some form of count regression - Poisson or negative binomial regression are the most common.

Whether this is the "right" analysis depends on exactly what your variables are and what you are trying to show and what it means that arm B has some 12s and so on.

$\endgroup$
0
$\begingroup$

I can't at all address what test the FDA requires for approval.

Based on the values you've given, it looks like the location shift assumption doesn't hold, in that the distributions of the two groups appear to be more different than just a added constant. Also, I think technically that shift assumption assumes continuous distributions.

Bar plot

I assume that your data describe an ordinal variable (endpoint, with 12 levels in your variable), and you have in your example 400 observations in each of two groups. If this is a fair representation, ordinal repression might be an ideal analysis. But in my experience, a two-sample Wilcoxon-Mann-Whitney test (WMW) handles data of this type well. Note that without the location shift assumption, the WMW tests a hypothesis of interest - if the probability of an observation from one group is likely to be larger than an observation from the other group. It is also easy to calculate a relevant effect size statistic: rank biserial correlation, Cliff's delta, or Vargha and Delaney's A.

Otherwise, if you really want to test for the mean or the median, you can find tests that do that.

At least as described in the example data, I probably wouldn't use a t test here.

$\endgroup$

Your Answer

By clicking “Post Your Answer”, you agree to our terms of service and acknowledge you have read our privacy policy.

Not the answer you're looking for? Browse other questions tagged or ask your own question.