0
$\begingroup$

I'd like to ask if I am understanding correctly the intuition behind two independent events A and B happening simultaneously:

(Note: I use asterisks here to depict multiplication)

Firstly, the sample space, $\Omega$, is the set of all possible outcomes. Thus, the probability of any outcome being in this space must be 1, as $\Omega$ encompasses all possibilities.

The probability of a specific event, A, is then some proportion of this sample space. Or, P(A) is the portion of events in $\Omega$ where A occurs.

Thus, if P($\Omega$) is the probability that an event occurs in $\Omega$, and the value of this probability is 1, then, P($\Omega$) * P(A) = 1 * P(A) = P(A)

I think it might look redundant, but I meant to convey that because the event being in the sample space $\Omega$ must happen, then P(A) can only be some fraction of this event.

Now, since the probability P(A$\cap$B) is being discussed, A and B must occur simultaneously to represent (A$\cap$B). And because both have to occur, we can allow either of these events to be analogous to the sample space $\Omega$ in the previous example.

Consider if B takes the place of the sample space from the previous example. In this sense, what I'm trying to say is that, conceptually, in the space of events where B occurs, P(A$\cap$B) is the portion of this space where A also occurs.

But, mathematically, we can use P(B) as the 'sample space' (because in this example, P(A$\cap$B) is being discussed, so both events have to happen), then P(A$\cap$B) is also just the portion of this 'new sample space'. So:

P(A$\cap$B) = P(B) * P(A)

I hope I'm not being confusing with trying to treat either P(B) or P(A) as the sample space, but in the end, what I wanted to communicate with that is that we can assume either event 'happens', then we only need the proportion of it where the other event also occurs, which is how the joint probability formula is arrived at. Of course, in my second example A and B can be conceptually switched.

EDIT: In my previous version of this post, I had confused some terms, so in my edit I have tried to use less technical terms to be more clear with what I mean. Please let me know if I have used terminology incorrectly.

$\endgroup$
4
  • $\begingroup$ Could you explain what the "$*$" sign means? On its left is a "probability space" while on its right is a number. Are you using "$\Omega$" simply as a symbol for the number $1$? But then assuming $1=\Omega=P(A)$ you are severely limiting the possibilities for $A.$ Help us understand your notation so we can understand your question. $\endgroup$
    – whuber
    Commented Feb 9, 2020 at 15:30
  • $\begingroup$ @whuber I apologise for the lack of clarity on my part, I will be more careful with notation in future posts and try to edit my original question. Firstly, I meant to use the asterisk, '*' in my example for multiplication. Also, I intended to use the omega symbol to represent the sample space, or the "set of all possible outcomes". Thus, to my understanding, the probability of an event occurring in the sample space must be 1. Because the sample space already encompasses all outcomes, P(A) can only represent some fraction of this space, I will edit my post to try and explain more $\endgroup$
    – Aiman
    Commented Feb 9, 2020 at 19:09
  • $\begingroup$ Please do not create new questions with same content but rather edit your question for clarifications. I merged your two questions. $\endgroup$
    – Tim
    Commented Feb 11, 2020 at 10:44
  • $\begingroup$ @Tim I do apologise, and will keep this in mind in future posts, thank you for informing me $\endgroup$
    – Aiman
    Commented Feb 11, 2020 at 15:10

1 Answer 1

0
$\begingroup$

I would say this is pretty much spot on; if you considered how to recover what fraction of $\Omega$ the events in the intersection of some As & Bs represent, you'd have also defined conditioning.

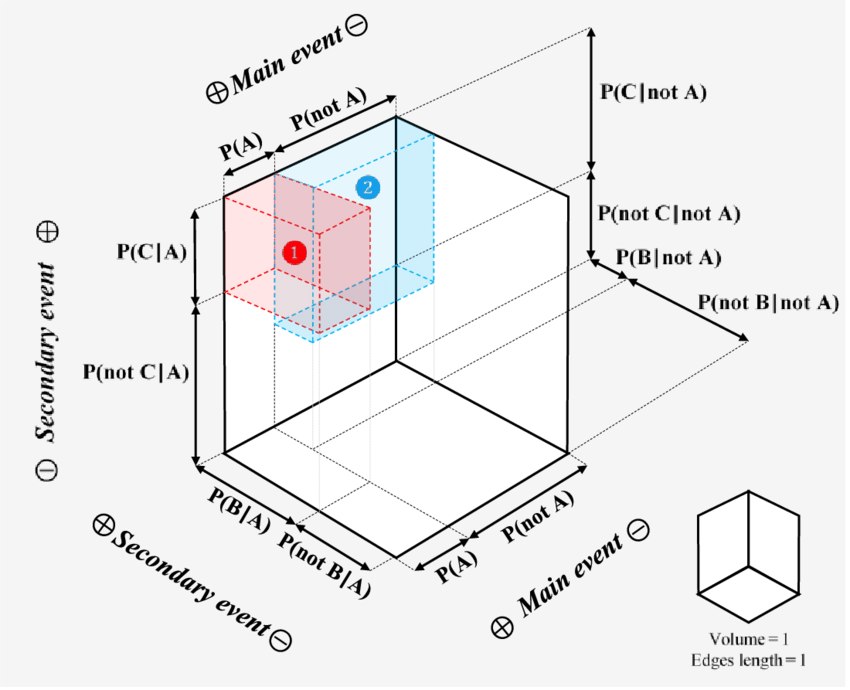
This visual intuition is often used in graphical proofs of the Bayes Theorem. I couldn't find the 2D one that really made it click for me, but here's a visualization for three variables:

(EXPLAINING THE BAYES’ THEOREM GRAPHICALLY - Scientific Figure on ResearchGate. Available from here [accessed 11 Feb, 2020])

$\endgroup$

Your Answer

By clicking “Post Your Answer”, you agree to our terms of service and acknowledge you have read our privacy policy.

Not the answer you're looking for? Browse other questions tagged or ask your own question.