Is it possible to have a (multiple) regression equation with two or more dependent variables? Sure, you could run two separate regression equations, one for each DV, but that doesn't seem like it would capture any relationship between the two DVs?
8 Answers
Yes, it is possible. What you're interested is is called "Multivariate Multiple Regression" or just "Multivariate Regression". I don't know what software you are using, but you can do this in R.
-
3$\begingroup$ One might add that fitting the regressions separateley is indeed equivalent to the multivariate formulation with a matrix of dependent variables. In R with package mvtnorm installed (1st: multivariate model, 2nd: separate univariate models): library(mvtnorm); X <- rmvnorm(100, c(1, 2), matrix(c(4, 2, 2, 3), ncol=2)); Y <- X %*% matrix(1:4, ncol=2) + rmvnorm(100, c(0, 0), diag(c(20, 30))); lm(Y ~ X[ , 1] + X[ , 2]); lm(Y[ , 1] ~ X[ , 1] + X[ , 2]); lm(Y[ , 2] ~ X[ , 1] + X[ , 2]) $\endgroup$– caracalCommented Nov 14, 2010 at 12:26
-
4$\begingroup$ If it's equivalent, what's the purpose? $\endgroup$ Commented Oct 26, 2015 at 23:43
-
1$\begingroup$ @JoshuaRosenberg one reason for running a multivariate regression over separate regressions with single dependent variables is the ability to conduct tests of the coefficients across the different outcome variables. For example, you can perform an F-test to see if a predictor has the same effect on one outcome variable as it has on another outcome variable. $\endgroup$– AlexKCommented Apr 27, 2019 at 6:33
@Brett's response is fine.
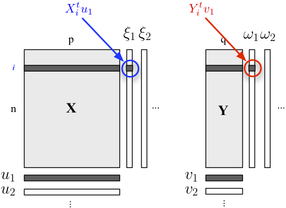
If you are interested in describing your two-block structure, you could also use PLS regression. Basically, it is a regression framework which relies on the idea of building successive (orthogonal) linear combinations of the variables belonging to each block such that their covariance is maximal. Here we consider that one block $X$ contains explanatory variables, and the other block $Y$ responses variables, as shown below:

We seek "latent variables" who account for a maximum of information (in a linear fashion) included in the $X$ block while allowing to predict the $Y$ block with minimal error. The $u_j$ and $v_j$ are the loadings (i.e., linear combinations) associated to each dimension. The optimization criteria reads
$$ \max_{\mid u_h\mid =1,\mid v_h\mid =1}\text{cov}(X_{h-1}u_h,Yv_h)\quad \big(\equiv \max\text{cov}(\xi_h,\omega_h)\big) $$
where $X_{h-1}$ stands for the deflated (i.e., residualized) $X$ block, after the $h^\text{th}$ regression.
The correlation between factorial scores on the first dimension ($\xi_1$ and $\omega_1$) reflects the magnitude of the $X$-$Y$ link.
-
$\begingroup$ I think a multipleX-multipleY PLS essentially does a multiple "multipleX-singleY" PLS. So the relations between Y variables are not addressed. $\endgroup$ Commented Nov 17, 2016 at 12:32
Multivariate regression is done in SPSS using the GLM-multivariate option.
Put all your outcomes (DVs) into the outcomes box, but all your continuous predictors into the covariates box. You don't need anything in the factors box. Look at the multivariate tests. The univariate tests will be the same as separate multiple regressions.
As someone else said, you can also specify this as a structural equation model, but the tests are the same.
(Interestingly, well, I think it's interesting, there's a bit of a UK-US difference on this. In the UK, multiple regression is not usually considered a multivariate technique, hence multivariate regression is only multivariate when you have multiple outcomes / DVs.)
-
3$\begingroup$ an addition at @Jeremy Miles answer: www-01.ibm.com/support/docview.wss?uid=swg21476743 $\endgroup$ Commented Sep 26, 2013 at 16:39
I would do this by first transforming the regression variables to PCA calculated variables, and then I would to the regression with the PCA calculated variables. Of course I would store the eigenvectors to be able to calculate the corresponding pca values when I have a new instance I wanna classify.
-
3$\begingroup$ This seems conceptually different than the answer above. I'm still not clear as to how transforming my variables to PCA coefficients allows me to regress on 2+ dependent variables? $\endgroup$– JeffCommented Nov 14, 2010 at 20:55
-
$\begingroup$ @Jeff this answer is actually conceptually similar to multivariate regression. Here, the suggestion is to do two discrete steps in sequence (i.e., find weighted linear composite variables then regress them); multivariate regression performs the two steps simultaneously. Multivariate regression will be more powerful, as the WLCV's are formed so as to maximize the regression. However, the two-step procedure may provide more clarity regarding the process, or be otherwise preferable for the researcher. $\endgroup$ Commented Jan 4, 2012 at 22:17
-
2$\begingroup$ @gung Hmm this sort of makes sense to me if you do PCA on the dependent variables and then regress on only the first principal component... But then you're still throwing out a lot of variance. $\endgroup$– JeffCommented Jan 24, 2015 at 19:11
-
2$\begingroup$ @Jeff, the PCs are orthogonal. You can run independent regressions on each. However, this is less powerful b/c the decomposition isn't quite the same, & the multivariate regression test isn't really a series of regs on the PCs. $\endgroup$ Commented Jan 24, 2015 at 20:54
-
$\begingroup$ @gung yes, you can run N independent regressions, but then you end up with N sets of beta coefficients. i don't understand how that solves the problem? $\endgroup$– JeffCommented Jan 24, 2015 at 21:25
As mentionned by caracal, you can use mvtnorm package in R. Assuming you made a lm model (named "model") of one of the response in your model, and called it "model", here is how to obtain the multivariate predictive distribution of several response "resp1", "resp2", "resp3" stored in a matrix form Y:
library(mvtnorm)
model = lm(resp1~1+x+x1+x2,datas)
         # this is only a fake model to get
                                  #the X matrix out of it
Y = as.matrix(datas[, c("resp1", "resp2", "resp3")])
X =  model.matrix(delete.response(terms(model)),
           data, model$contrasts)
XprimeX  = t(X) %*% X
XprimeXinv = solve(xprimex)
hatB =  xprimexinv %*% t(X) %*% Y
A = t(Y - X%*%hatB)%*% (Y-X%*%hatB)
F = ncol(X)
M = ncol(Y)
N = nrow(Y)
nu= N-(M+F)+1 #nu must be positive
C_1 =  c(1  + x0 %*% xprimexinv %*% t(x0))
     # for a prediction of the factor setting x0
     # (a vector of size F=ncol(X))
varY = A/(nu)
postmean = x0 %*% hatB
nsim = 2000
ysim = rmvt(n=nsim, delta=postmux0, C_1*varY, df=nu)
Now, quantiles of ysim are beta-expectation tolerance intervals from the predictive distribution, you can of course directly use the sampled distribution to do whatever you want.
To answer Andrew F., degrees of freedom are hence nu=N-(M+F) + 1 ... N being the # of observations, M the # of responses and F the # of parameters per equation model. nu must be positive.
(You may want to read my work on in this document :-) )
Did you already come across the term "canonical correlation"? There you have sets of variables on the independent as well as on the dependent side. But maybe there are more modern concepts available, the descriptions I have are all of the eighties/nineties...
-
1$\begingroup$ Canonical correlation is the correlation between factor scores computed from two-block structures, as with CCA or PLS. This is exactly what I described in my response (PLS regression), although PLS is more appropriate than CCA when the variables play an asymmetrical role, which is likely to be the case here. This is because there's an asymmetric deflation process and we work with the covariance instead (with CCA, we deflate both blocks at the same time, and we seek to maximize the correlation, instead of the covariance). $\endgroup$– chlCommented Nov 16, 2010 at 7:50
-
$\begingroup$ @chl: upps- today(end of january) I came back to this question/conversation of mid-november.... Sorry I didn't check earlier - there was something with my courses and then I forgot the stat.exchange... If I've something worth I'll come back next days. $\endgroup$ Commented Jan 28, 2011 at 23:23
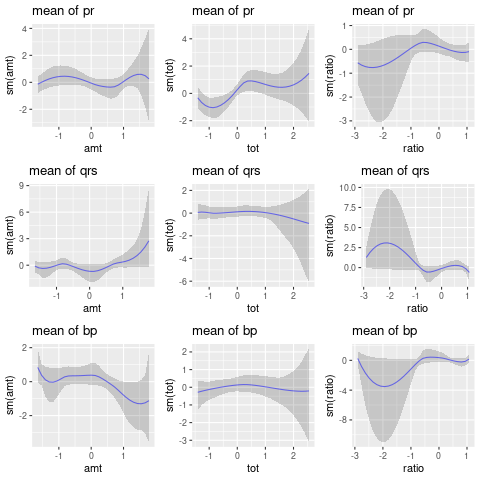
For Bayesian multivariate regression, one can use R package BNSP. For example, the dataset ami that comes with the package includes 3 responses and 3 covariates.
# First load the package and dataset
require(BNSP)
data(ami)

# Second, centre and scale variables -
# this is specific to the dataset
sc <- function(x){return((x-mean(x))/sd(x))}
ami$ratio <- sc(log(ami$ami)-log(ami$tot))
ami$tot <- sc(log(ami$tot))
ami$amt <- sc(log(ami$amt))
ami$pr <- sc(ami$pr)
ami$qrs <- sc(ami$qrs)
ami$bp <- sc(ami$bp)

##Third, define the mode: on the left of ~
# are the 3 responses, separated by |.
# On the right of ~ is the model for the mean that
# includes smooth functions sm
# of the 3 covariates: amt, tot, and ratio

model <- pr | qrs | bp ~ sm(amt, k = 5) + sm(tot, k = 5) +
           sm(ratio, k = 5)

#Fourth, fit the model
multiv <- mvrm(formula = model, data = ami, sweeps = 10000,
            burn = 5000, thin = 2, seed = 1,
             StorageDir = getwd())

# And last, plot the fitted curves and estimated
# correlation matrix
plot(multiv, nrow = 3)
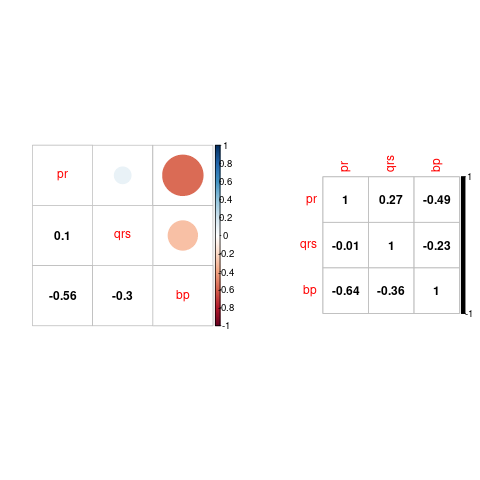
plotCorr(multiv)
Results are shown below. For the correlation matrix, the plot of the left shows posterior means and the one on the right posterior credible intervals.
It's called structural equation model or simultaneous equation model.
-
3$\begingroup$ I could be wrong, but I don't think this is the same thing. From SEM graphs that I've seen, it looks like SEM uses multiple regression equations to determine the values of latent factors, and then another regression is run on the value of those latent factors to determine a higher-order factor. Maybe this is wrong, but I've never seen an SEM graph that links several IVs to multiple DVs-- everything is hierarchical. $\endgroup$– JeffCommented Nov 14, 2010 at 20:59
-
$\begingroup$ Figure 8 in this paper: biomedcentral.com/1471-2288/3/27 You can do it, but there's little point. It's the same as MANOVA. $\endgroup$ Commented Mar 25, 2013 at 16:15


