I started following the tutorial to create a linear regression model with scikit from here inside jupyter notebook.
Then I decided to do a k-cross validation and plot the learning curves.
The code I wrote is this one
import numpy as np
import pandas as pd
import matplotlib.pyplot as plt

from sklearn.model_selection import train_test_split
from sklearn.linear_model import LinearRegression
from sklearn.model_selection import learning_curve
%matplotlib inline
...
# Load dataset, prepare the dataset, show dataset infos...
...
# Prepare training and testing set with 80:20 ratio
test_size = 0.2
X_train, X_test, y_train, y_test = train_test_split(X, y, test_size=test_size, random_state=42)
print("DATA SIZES from total of", X.size)
print("Training size: ", 100-test_size*100, "% of", X.size, "=", X_train.size)
print("Test size: ", test_size*100, "% of", X.size, "=", y_test.size)

# Prepare various training sizes for cross validation
train_sizes_1 = np.array([1, 19047, 38093, 57139, 76185])
train_sizes_2 = np.array([0.00001, 0.12, 0.325, 0.55, 0.775, 1.])
train_sizes_3 = np.array([0.001, 0.12, 0.325, 0.55, 0.775, 1.])

# Do k-cross validation and save learning/validation errors
regressor = LinearRegression()
val_train_sizes, val_train_scores, val_scores = learning_curve(
    regressor, X_train, y_train, train_sizes=train_sizes_1, cv = 6, scoring='neg_root_mean_squared_error')

val_train_scores_mean = -val_train_scores.mean(axis=1)
val_scores_mean = -val_scores.mean(axis=1)
print('Mean training scores\n\n', pd.Series(val_train_scores_mean, index=val_train_sizes))
print('\n', '-' * 20)
print('\nMean validation scores\n\n', pd.Series(val_scores_mean, index=val_train_sizes))

learning_curves_figure = plt.figure(figsize=(10,6))
plt.title("Regression Model Learning Curve")
plt.xlabel("Training set size")
plt.ylabel("RMSE")
plt.plot(val_train_sizes, val_train_scores_mean, "o-", color="g", label='Training error')
plt.plot(val_train_sizes, val_scores_mean, "o-", color="r", label='Validation error')
plt.legend()
...
# Fit the model, predict test and show model infos...
...
train_sizes_1(with manually selected sizes) and train_sizes_2(with percentages) both start with 1 sample(I took the idea from here) to use for the first cross-validation while test_sizes_3(with percentages) starts with multiple samples.
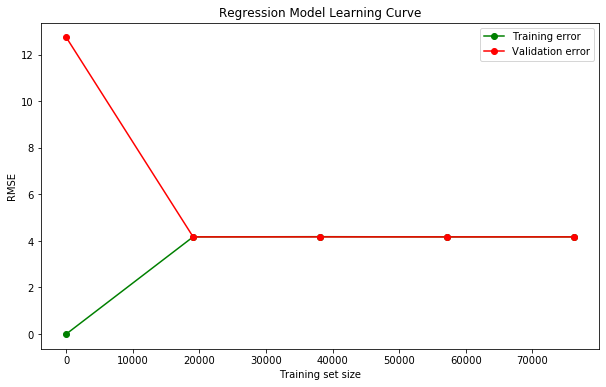
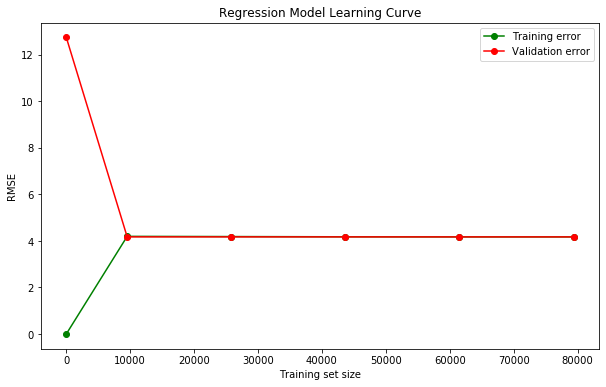
What happens with train_sizes_1 and train_sizes_2 is that the learning curves are pretty much like this

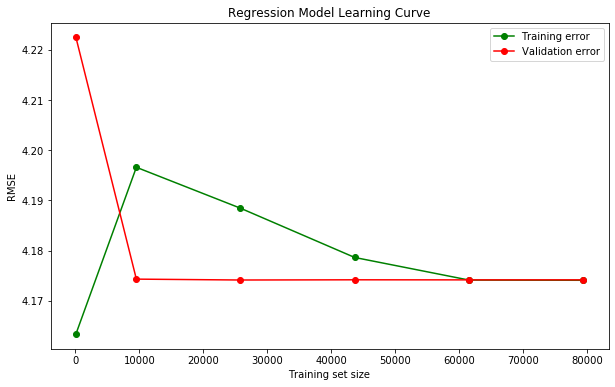
but with train_sizes_3 I get this

My questions are:
- Are the curves actually telling something that I'm not understanding or there's a programming error misleading me ?
- If the curves are not wrong, what is actually happening with the changing of the first training size ?


