2
$\begingroup$

this may be a beginners question but any help is appreciated!

I'm looking to compare the length frequencies of fish caught by two different nets using a linear mixed effect model. In this study the 'control net' and 'trial net' were towed together (twin rig trawl) for several repeated hauls. The dataframe contains the number of fish of length L caught by each net for each haul. An example dataframe is given below:

#generate random lengths for each haul
haul1length <- sort(sample(20:100, 50, replace=FALSE))
haul2length <- sort(sample(20:100, 50, replace=FALSE))
haul3length <- sort(sample(20:100, 50, replace=FALSE))
haul4length <- sort(sample(20:100, 50, replace=FALSE))
haul5length <- sort(sample(20:100, 50, replace=FALSE))
length <- c(haul1length, haul2length, haul3length, haul4length, haul5length)

#dataframe contains 5 hauls (replicates) with length frequency counts for the control net and trial net
dataframe <- data.frame("haul" = rep(1:5, each=50), "length"=length, "control"=sample(0:150, 250, replace=TRUE), "trial"=sample(0:150, 250, replace=TRUE))
dataframe

The aim is to compare the expected proportion of fish retained by the trial net per length class (compared to the control net). I'm attempting to do this using a linear mixed model with proportion retained i.e.:

P(L) = n(L)trial / (n(L)trial + n(L)control)

using length as the fixed effect and haul number as the random effect:

install.packages("lme4")
library(lme4)
lmer <- lmer((trial/(trial+control)) ~ length + (1|haul), data=dataframe)

I'm looking to explore the model graphically if possible to produce something like this: the proportion (P) at length (L) of the total catch retained by the trial net

(wherein the dotted line P=0.5 indicates no difference between the trial and control catches)

Is this model right for my data? And if so, how do I go about interpreting in? Much appreciated

$\endgroup$

2 Answers 2

3
$\begingroup$

You have count data,the response can be interpreted as success (trial net) vs failure( control net), so you should use a logistic mixed model:

set.seed(111)
haul1length <- sort(sample(20:100, 50, replace=FALSE))
haul2length <- sort(sample(20:100, 50, replace=FALSE))
haul3length <- sort(sample(20:100, 50, replace=FALSE))
haul4length <- sort(sample(20:100, 50, replace=FALSE))
haul5length <- sort(sample(20:100, 50, replace=FALSE))
length <- c(haul1length, haul2length, haul3length, haul4length, haul5length)

dataframe <- data.frame("haul" = rep(1:5, each=50), 
"length"=length, "control"=sample(0:150, 250, replace=TRUE),
"trial"=sample(0:150, 250, replace=TRUE))

# i think your values are a bit odd, so it might complain
dataframe$length = dataframe$length/10

log_lmer <- glmer(cbind(trial,control) ~ length + (1|haul), 

data=dataframe,family="binomial")

You can look at the coefficients:

summary(log_lmer)

Generalized linear mixed model fit by maximum likelihood (Laplace
  Approximation) [glmerMod]
 Family: binomial  ( logit )
Formula: cbind(trial, control) ~ length + (1 | haul)
   Data: dataframe

     AIC      BIC   logLik deviance df.resid 
  8740.5   8751.0  -4367.2   8734.5      247 

Scaled residuals: 
    Min      1Q  Median      3Q     Max 
-12.707  -3.601   0.072   2.904  12.251 

Random effects:
 Groups Name        Variance Std.Dev.
 haul   (Intercept) 0.01838  0.1356  
Number of obs: 250, groups:  haul, 5

Fixed effects:
             Estimate Std. Error z value Pr(>|z|)    
(Intercept) -0.334905   0.067092  -4.992 5.98e-07 ***
length       0.045095   0.004515   9.987  < 2e-16 ***
---

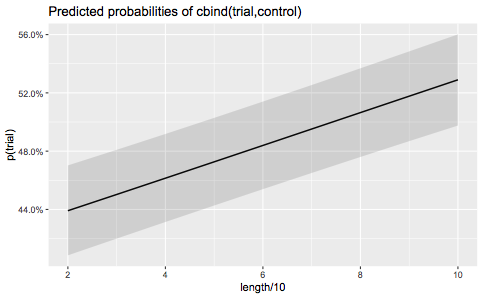
It tells you for every increase of 10 in length(because we regressed against length/10), the log odds ratio of trial vs control goes up by 0.045. You can also plot this in probability:

library(sjPlot)
plot_model(log_lmer,"eff",axis.title=c("length/10","p(trial)"))

enter image description here

$\endgroup$
2
$\begingroup$

I'd recommend the package 'sjPlot' which may help plotting mixed models. There are multiple vignettes that may steer towards what you're looking for.

$\endgroup$

Your Answer

By clicking “Post Your Answer”, you agree to our terms of service and acknowledge you have read our privacy policy.

Not the answer you're looking for? Browse other questions tagged or ask your own question.