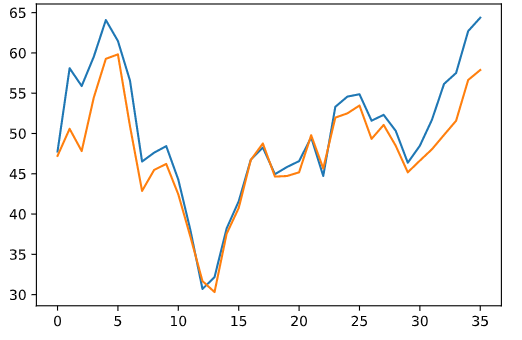
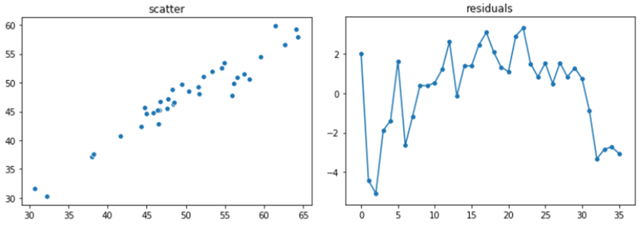
I'm struggling with testing the cointegration of 2 time series (or rather interpreting the test results properly).
So I got 2 time series x and y each containing 36 monthly data points (oil prices).
From looking at those time series, I'd say they are cointegrated.
However when applying different cointegration tests, they don't seem to be:
1) Augmented Dickey-Fuller
 from statsmodels.tsa.stattools import adfuller
 from statsmodels.api import OLS

 ols_result = OLS(y, x).fit()
 result = adfuller(ols_result.resid)
returns
 (0.6614451366946532,
 0.9890361840444819,
 10,
 25,
 {'1%': -3.7238633119999998, '5%': -2.98648896, '10%': -2.6328004},
 84.12263429255607)
i.e. a p-value of 0.98; null hypothesis cannot be rejected, time series are not cointegrated.
2) Engle-Granger
 coint_t, p_value, _ = coint(y, x)
 p_value
 0.06910078732250052
returns a p-value of 0.069 i.e. not cointegrated.
What am I doing wrong here?
Thanks in advance!
PS: there seems to be Granger-Causality between the 2 time series (tested using statsmodels.tsa.stattools.grangercausalitytests)


OLS_result.resid? $\endgroup$