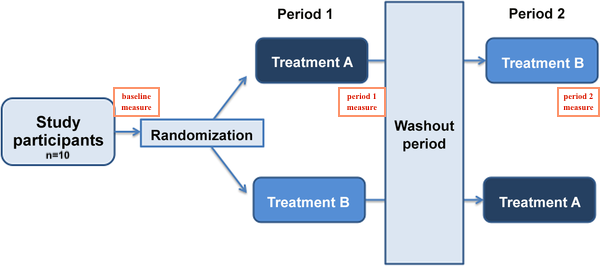
I'm working on a dataset of 2x2 crossover study. I have 10 subjects, each of them underwent both A and B treatment but in a different sequence. (This is a balanced study.)
I want to see how A and B treatments improve lipid levels. My thought process was to create a linear mixed model with subjects as a random effect; treatment, sequence, and period as the fixed effects; finally, sex and age as covariates.
My data:
#Reproducible data
id <- rep(1:10,3)
age <- rep(c("59","59","70","67","66","70","70","68","71","57"),3)
sex <- rep(c("F","M","F","M","F","F","F","M","F","M"),3)
sequence <- rep(c("1","2","1","2","1","2","1","2","2","2"),3)
period <- c(rep(0,10),rep(1,10),rep(2,10))
Treatment <- c(rep("C",10), rep(c("A","B"),4), "B","B",rep(c("B","A"),4), "A","A") #C is baseline
lipid <- c(18,6,30,12,14,19,10,22,22,27,13,28,14,23,12,27,9,10,13,22,13,22,29,12,16,24,15,13,17,11)
DF <- data.frame(id,age,sex,sequence,period,Treatment,lipid)

 > head(DF)
      id age sex sequence period Treatment lipid
    1  1  59   F        1      0         C    18
    2  2  59   M        2      0         C     6
    3  3  70   F        1      0         C    30
    4  4  67   M        2      0         C    12
    5  5  66   F        1      0         C    14
    6  6  70   F        2      0         C    19
My linear mixed model:
library(lmerTest)
lm1 <- lmer(lipid~Treatment + sequence + period + sex + age + (1|id), data = DF, REML = F)

> summary(lm1)

Random effects:
 Groups   Name        Variance Std.Dev.
 id       (Intercept)  1.344   1.159
 Residual             34.986   5.915
Number of obs: 30, groups:  id, 10

Fixed effects:
            Estimate Std. Error      df t value Pr(>|t|)
(Intercept)  23.7890    18.2664 10.1410   1.302    0.222
TreatmentA   -2.8500     2.8572 20.0000  -0.997    0.330
TreatmentB    2.2750     3.1018 20.0000   0.733    0.472
sequence2     4.7080     3.3324 10.0000   1.413    0.188
period1      -1.1250     2.6998 20.0000  -0.417    0.681
sexM         -3.8351     3.7742 10.0000  -1.016    0.334
age          -0.1078     0.2734 10.0000  -0.394    0.702
After building a linear mixed model, I wanted to do post-hoc test to compare treatment A and B. I tried both emmeans and multcomp but they are giving me different results.
Emmeans:
library(emmeans)
emm <- emmeans(lm1,"Treatment")
pairs(emm, adjust = "fdr")

> pairs(emm, adjust = "fdr")
 contrast estimate   SE   df t.ratio p.value
 C - A      nonEst   NA   NA     NA      NA
 C - B      nonEst   NA   NA     NA      NA
 A - B       -5.12 2.93 23.5 -1.750  0.2794
Multicomp:
library(multcomp)
summary(glht(lm1, linfct = mcp(Treatment = "Tukey")), test = adjusted("fdr"))

> summary(glht(lm1, linfct = mcp(Treatment = "Tukey")), test = adjusted("fdr"))
Linear Hypotheses:
           Estimate Std. Error z value Pr(>|z|)
A - C == 0   -2.850      2.857  -0.997    0.463
B - C == 0    2.275      3.102   0.733    0.463
B - A == 0    5.125      2.700   1.898    0.173
(Adjusted p values reported -- fdr method)
I guess question would be,
1) Based on the study design, does my linear mixed model lm1 <- lmer(lipid~Treatment + sequence + period + sex + age + (1|id), data = DF, REML = F) look ok? Or should I account for other interaction terms (ex. Treatment*sequence)?
2) Why does emmeans give me NAs in C-A and C-B when multcomp gives me values? Which one would you recommend to conduct the post-hoc test on lmer model since the results are different?
Any thought is appreciated, thank you!


periodas a predictor the model can’t properly distinguish their effects. Try repeating the modeling without theperiodpredictor (not clear to me what that accomplishes) and one part of your question might solve itself. $\endgroup$emmeans, see this answer! $\endgroup$