I'm doing logistic regression with two classes (A and B), and I'd like to be able to describe the outputs of the model in terms of (calibrated) probabilities that each sample is in class A or B. If there are a lot of (both train and test) samples, logistic regression seems to be well behaved in terms of calibration - see https://scikit-learn.org/stable/auto_examples/calibration/plot_compare_calibration.html
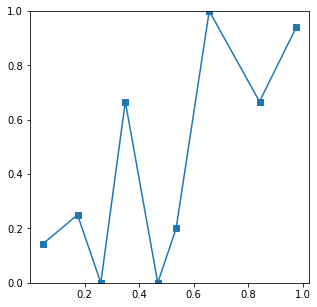
However, if the number of samples is small, the calibration curves become very noisy. I think that is not simply an issue with calibration but rather reflects real uncertainty in the model outputs.
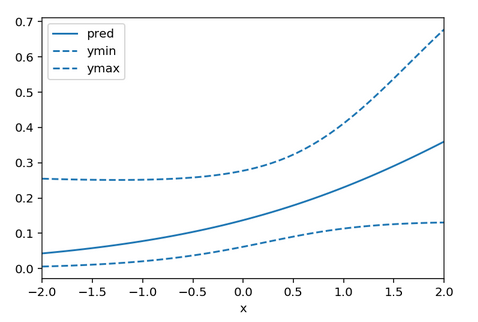
How do I calculate the confidence interval around the output of a logistic regression model, in terms of real class probabilities?
Simple example of calibration curves in python:
# make dataset
N = 100
X, y = sklearn.datasets.make_classification(n_samples=N)
train = np.zeros_like(y).astype(bool)
train[:N//2] = True
test = ~train
# train logistic regression model
reg = sklearn.linear_model.LogisticRegression(max_iter=1000)
reg.fit(X[train], y[train])
y_pred = reg.predict_proba(X[test])
# show calibration curve
fraction_of_positives, mean_predicted_value = sklearn.calibration.calibration_curve(y[test], y_pred[:,1], n_bins=10)
plt.plot(mean_predicted_value, fraction_of_positives, "s-")
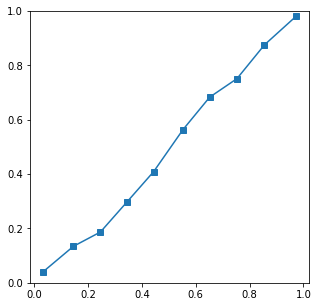
Results with N=10000 have a well behaved calibration curve
and with N=100 a very noisy curve


