0
$\begingroup$

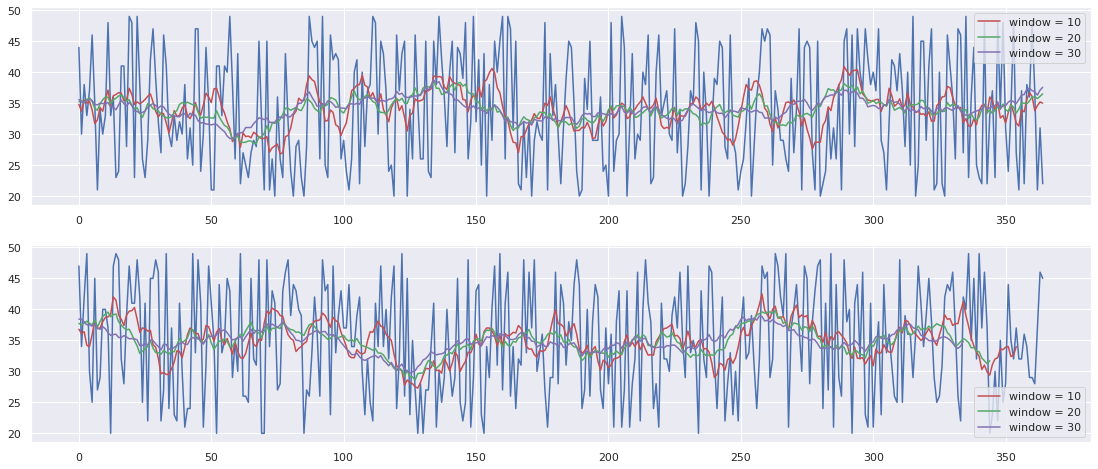
I am new to time series modelling and I was trying my hands on a dataset which records number of customers per day from 1 jan 2018 to 31 dec 2019. So far, I have tried implementing a naive moving average and got the following results.

Moving average results

Is this a legitimate fit? If this is not a right model, what approach should I use? Thanks

Things I have done:

  • Checked data for stationarity: Data is stationary
  • Implemented a moving average by calculating the average of previous 'window' number of observations as in the plot above.

Link to Jupyter Notebook

$\endgroup$
4
  • $\begingroup$ What's the goal of your analysis? $\endgroup$ Commented Jul 3, 2020 at 6:06
  • $\begingroup$ @kevin012 I want to predict the number of customers for the next few months $\endgroup$ Commented Jul 3, 2020 at 6:07
  • $\begingroup$ The size of the noise seems huge. How large of prediction variance is allowed? $\endgroup$ Commented Jul 3, 2020 at 6:41
  • $\begingroup$ @kevin012 there wasn't anything specific about prediction variance, so consider something that works well $\endgroup$ Commented Jul 3, 2020 at 6:50

1 Answer 1

1
$\begingroup$

The signal to noise ratio of your data is very low from your graph. If you don't have more fine-grained data than the day interval, it would be difficult to improve the model dramatically whatever MA model you implement.

One way to improve is to describe the volatility directly. You can start with GARCH model which is one of the common models for volatility. (Actually, it models conditional volatility.)

Also, notice that your graph shows volatility clustering which means that there are areas of fast or slow price change than the other areas. And the GARCH type model is specialized to catch the pattern.

$\endgroup$

Your Answer

By clicking “Post Your Answer”, you agree to our terms of service and acknowledge you have read our privacy policy.

Not the answer you're looking for? Browse other questions tagged or ask your own question.