1
$\begingroup$

I have the following statistical setting:

I have two unknowns $a$ and $b$ an I have two measurements of their values corrupted by noise distibuted uniformly in $[-e,e]$ and I have exact value of $e$ known to me beforehand. I also have a measurement of $d = a - b$ obtained by another method. This measurement is corrupted by a Gaussian noise with variance that I don't know in general, but I can obtain it's estimate in principle if it's necessary. Also this estimate $d$ can be subject to a gross error (outlier) with very large variance so in general the error in $d$ is given by a mixture of a Gaussian and a uniform. The mixing parameter that determines relative weight of a Gaussian and a uniform in the mixture is not known to me and cannot be obtained by any means. Also the method for measuring difference of $a$ and $b$ is way more accurate then separate estimates of $a$ and $b$ when there is no outlier in the mix.

My goal is to establish a reliability measure of measurement $d=a-b$. It's clear that individual measurements of $a$ and $b$ can in certain cases help me identify outliers in $d$. If we consider all possible values of a and b that could have resulted in the measurements that I observe, there may be no possible pair that is close to obtained measurement of $d$ and it clearly suggests that there's an outlier in such a case.

This reliability measure is supposed to be used in a big least squares estimator. I have millions of $a$'s and $b$'s and millions of measurements of their differences. I do a big least squares fit of all this data by minimizing a weighted sum of residuals given by individual measurements and pairwise difference measurements and I want to weight pairwise differences by some weight that reflects their reliability and it's really important to come up with such a measure since outliers will affect least squares alot if they are not attended to.

I see many heuristical ways to cook up such a measure, the most simple being 0 weight to difference measurements that completely disagre with observed individual measurements and 1 otherwise.

But maybe there is a better way of doing this. Do you guys see some non heuristical theoretically sound approach to divise a reliability measure that is to be used in least squares (essentially Maximum Likelihood) estimator in such a setting?

$\endgroup$

1 Answer 1

2
$\begingroup$

Your measurement process is somewhat complex. The following is the case

$ \begin{split} a &= {\cal A} + \epsilon \\ b &= {\cal B} + \epsilon \\ \epsilon &\sim {\rm u}(-e,e) \\ \\ d &= ({\cal A} - {\cal B}) + \xi \\ \xi &\sim {\rm g}(0,\sigma^2) \end{split} $

where u denotes the uniform distribution and g the normal distribution.

Hence, your noise process looks as follows

$ d_i = \left ( {\cal A} - {\cal B} \right) \circledast g(0,\sigma^2) $

with $\circledast$ the convolution operator and $i$ the index of the i'th measurement in your sample.

Robustness

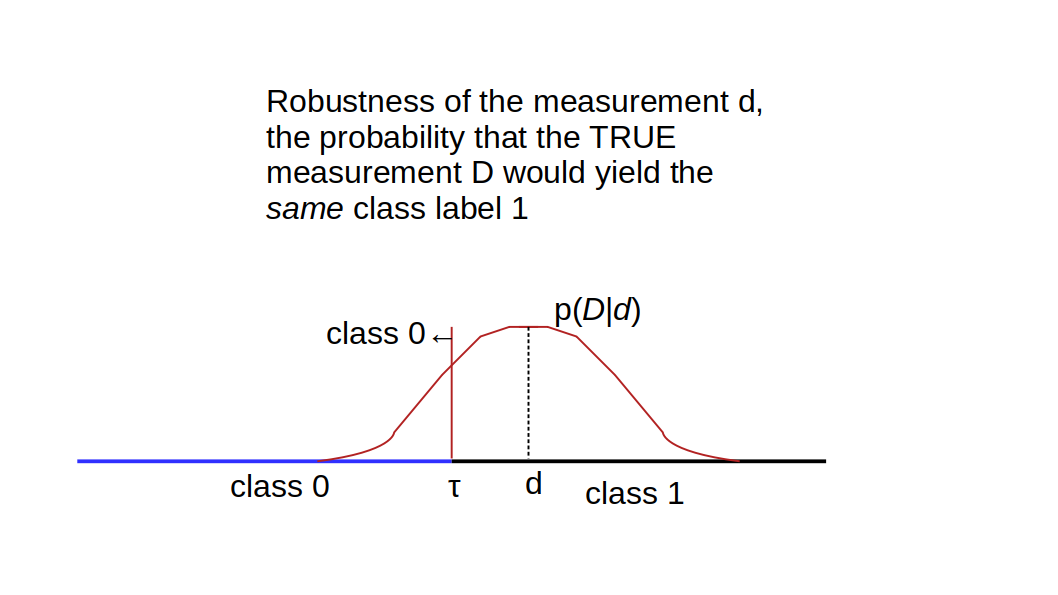
You require a reliability measure for the measurement $d$. For a classification problem where $d$ has to exceed some threshold $\tau$ to be assigned class label $1$, there is a solution at hand. One such attempt is called robustness, which is defined as follows

"The robustness of a classification of a case is the probability that the case would obtain the same class label if the (unknown) true attribute values were known." [Egmont-Petersen, 1997]

In the reference, the robustness measure $\varrho$ is defined as

$ \begin{split} \varrho(d) = \int_{S} p({\cal D} \mid d) \, d{\cal D} \end{split} $

where ${\cal D}$ is the true but unknown value whereas $d$ is the observed value with all the noise in it. The region $S$ indicates the part of the measurement space (the interval) that is associated with the measured outcome $d$. The decision threshold $\tau$ demarcates the boundary of the interval $S$.

So the measure $\varrho$ integrates the conditional density $p({\cal D} \mid d)$, over the interval where ${\cal D}$ would have resulted in the same class outcome $1$.

The density $p({\cal D} \mid d)$ is unknown, but we know $p(d \mid {\cal D})$ from the convolution formula above. This convolution does have an analytical solution.

Now to robustness, we apply Bayes rule

$ \begin{split} \varrho(d) = \int_{S} \frac{p(d \mid {\cal D}) p({\cal D})}{p({\cal d})} \, d{\cal D} \end{split} $

and you have a reliability measure for your measurement $d$ - the robustness $\varrho(d)$. In practical sense, $p(d \mid {\cal D})$ is given by the convolution above. The density $p({\cal D})$ needs to be obtained from some controlled experiment with repeated measurements. Finally, $p({\cal d})$ is just the distribution of $d$ over all your data.

This picture shows the computation of $\varrho(d)$ for a given measurement $d$, for a two-class situation.

Reference

M. Egmont-Petersen, J.L. Talmon, A. Hasman1, "Robustness metrics for measuring the influence of additive noise on the performance of statistical classifiers," International Journal of Medical Informatics, Vol. 46, No. 2, pp. 103-112, 1997.

$\endgroup$
2
  • $\begingroup$ Thank you very much for comment! I will look into the paper, from your comment alone I do not completely get it. However there is one thing in your post that is not correct - when I measure d there is no uniform noise in this measurement, it's only in individual measurements. Does what you suggest still hold given this fact? $\endgroup$ Commented Jul 30, 2020 at 22:29
  • $\begingroup$ I have adapted the answer now to incorporate your comments. Also a graph is included. $\endgroup$ Commented Jul 31, 2020 at 5:22

Your Answer

By clicking “Post Your Answer”, you agree to our terms of service and acknowledge you have read our privacy policy.

Not the answer you're looking for? Browse other questions tagged or ask your own question.