3
$\begingroup$

I have three points $A(x,y) , B(x,y)$ and $C(x,y)$ the $x$ and $y$ coordinates follow a normal distribution with a known mean and variance. I don,t know if $A$ and $B$ are correlated with each other. I know $C$ dont have an correlation with $A$ and $B$.

There is a line made bij $AB$ and the point $C$. i want to calculate the distance from $C$ to the line $AB$. that means there is an orthogonal line from $C$ on $AB$. the length of that line is calculed with the next formule : $det(A)/|a-b|$ $A$ is an matrix made bij $(a-c,a-b)$

Atm i am using a monte carlo simulation to find the variance and mean. with the simulation, i found that the distance follow a normal distribution. Anyone can help me out? Is it possible to calculate the variance of the length of the orthogonal line without the use of a simulation?
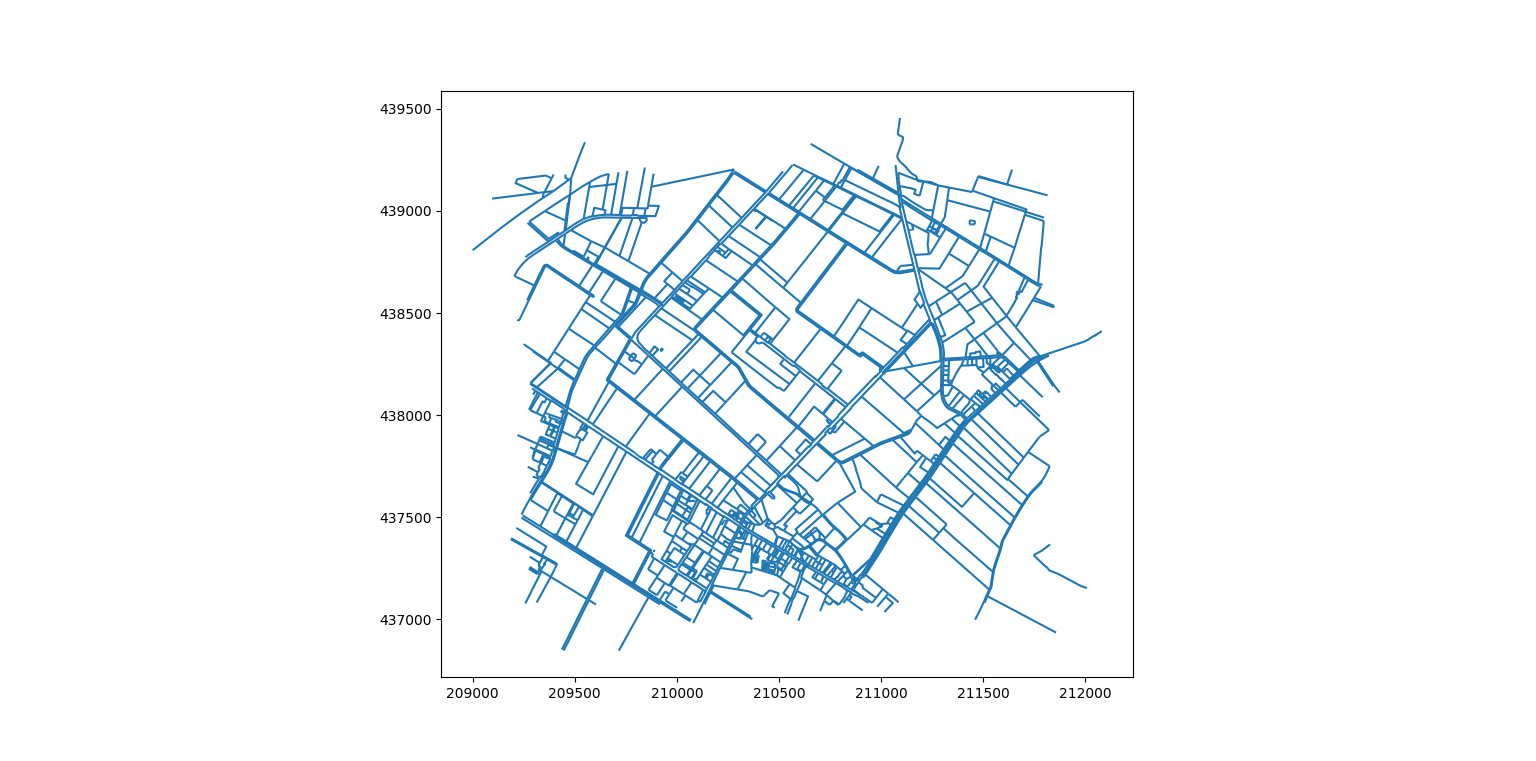
the plot of the lines (road map) I am not allowed to upload the plot of the points. the dataframe of the points excist of 4096 points located on the map. i have to find for each point a line with the smallest distence. the points are from an other map. the company want to combine those maps to create an better map

$\endgroup$
3
  • $\begingroup$ Do the $x$ and $y$ follow different distributions for different points A,B and C? $\endgroup$ Commented Nov 11, 2020 at 18:02
  • $\begingroup$ yes. they follow different distributions.(still normal distributed but different variance) $\endgroup$
    – J.Kuiper
    Commented Nov 11, 2020 at 20:08
  • 1
    $\begingroup$ This looks like a street map. If you can not share the data, could you maybe explain the nature of the points? $\endgroup$ Commented Nov 12, 2020 at 20:52

1 Answer 1

1
$\begingroup$

The distributions can be wildly varying depending on the distributions of A, B and C.

So I think that it will be difficult to give a simple solution if there is not a clear specification of the distribution, based on which simplifications can be made.

Example for a funny distribution

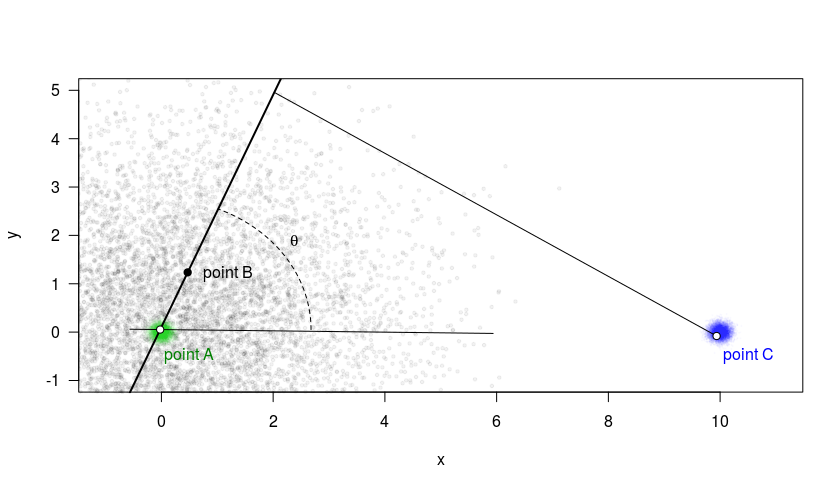
Let A and B be two distributions centered around $(0,0)$ with A very small variance and B a very large variance.

This makes that the line between A and B is more or less the line through $(0,0)$ and B, or a line through $(0,0)$ with an angle that is homogeneously distributed.

Let C be a distribution far away from $(0,0)$ with small variance. In the computed example below, we used C centered around $(10,0)$

example

Then the distance of C from the line is more or less equal to

$$d \approx 10 \sin(\theta)$$

Where $\theta$ is the angle between the line through point B and the x-axis.

If we consider the angle is homogenously distributed from $0$ to $\pi$ then you can compute the distribution of $d$ by transformation:

$$\theta = \sin^{-1}(d/10)$$

and the derivative can be used to compute the distribution of the transformed variable

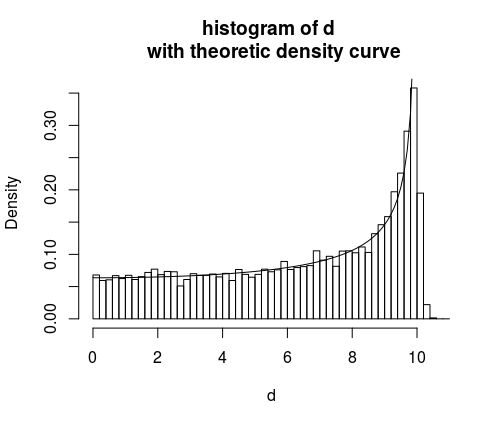
$$f(d) = \frac{2}{\pi \sqrt{100-d^2}}$$

Computation example:

example

set.seed(1)

### https://en.wikipedia.org/wiki/Distance_from_a_point_to_a_line#Line_defined_by_two_points
distance <- function(x0,y0,x1,y1,x2,y2) {
  abs((y2-y1)*x0-(x2-x1)*y0+x2*y1-y2*x1)/sqrt((x2-x1)^2+(y2-y1)^2)
}

n <- 10^4
x0 <- rnorm(n,mean = 10,sd = 0.1)
y0 <- rnorm(n,mean = 0,sd = 0.1)
x1 <- rnorm(n,mean = 0,sd = 2)
y1 <- rnorm(n,mean = 0,sd = 2)
x2 <- rnorm(n,mean = 0,sd = 0.1)
y2 <- rnorm(n,mean = 0,sd = 0.1)

d <- distance(x0,y0,x1,y1,x2,y2)

hist(d, breaks = seq(0,11,0.2), freq = 0, main = "histogram of d \n with theoretic density curve")
ds <- seq(0,10,0.1)
lines(ds , (2/pi)/sqrt(100-ds^2))
$\endgroup$
7
  • $\begingroup$ the only thing i know is that c has a small distribution. A and B can be different. is there an easy solution of A en B use an equal variance? $\endgroup$
    – J.Kuiper
    Commented Nov 12, 2020 at 7:29
  • $\begingroup$ Also there is one thing i forgot. the x and y coordinates of A and B are not equal. it is possible that a C=A or C=B $\endgroup$
    – J.Kuiper
    Commented Nov 12, 2020 at 12:51
  • 1
    $\begingroup$ @J.Kuiper I am afraid that these pieces of information are not enough to make the problem simpler. $\endgroup$ Commented Nov 12, 2020 at 12:53
  • $\begingroup$ @J.Kuiper aren't you accepting this answer prematurely? The answer explains why the type of distributions of the distance can vary a lot for the given problem setup, but I can imagine that it is possible to describe it more precisely and some approximations might be possible if you would have better descriptions of the distributions of the points a, b and c. $\endgroup$ Commented Nov 12, 2020 at 15:09
  • $\begingroup$ the problem is, i don.t have an better discription of a,b,c. I have an list of points C with given variance, I have an list of lines with starting point A and End point B. those points are points on a (inaccurate) map. i don,t have any more information about those points $\endgroup$
    – J.Kuiper
    Commented Nov 12, 2020 at 17:18

Your Answer

By clicking “Post Your Answer”, you agree to our terms of service and acknowledge you have read our privacy policy.

Not the answer you're looking for? Browse other questions tagged or ask your own question.