I'm working on the following dataset : https://archive.ics.uci.edu/ml/datasets/gene+expression+cancer+RNA-Seq
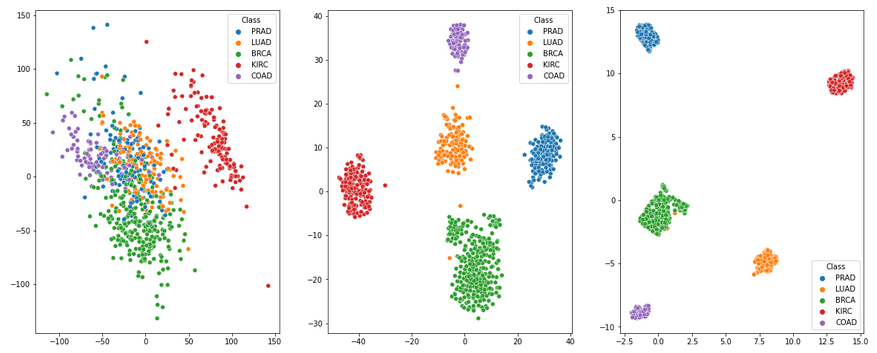
I start by looking at PCA/TSNE/UMAP to have a first sight, on all the data using the following code :
# Prepare plots
fig, (ax1, ax2, ax3) = plt.subplots(1,3,figsize=(20,8))

# remove sample name and scale
#df = df.drop('Unnamed: 0', axis=1)
x = StandardScaler().fit_transform(df)

# PCA
pca = PCA(n_components=2)
principalComponents = pca.fit_transform(x)
principalDf = pd.DataFrame(data = principalComponents
         , columns = ['principal component 1', 'principal component 2'])

finalDf = pd.concat([principalDf, label[['Class']]], axis = 1)#add cancer type
sns.scatterplot(principalComponents[:,0], principalComponents[:,1], hue=label['Class'], legend='full', ax=ax1)

# TSNE
fashion_tsne = TSNE().fit_transform(x)
sns.scatterplot(fashion_tsne[:,0], fashion_tsne[:,1], hue=label['Class'], legend='full', ax=ax2)

# UMAP
reducer = umap.UMAP()
embedding = reducer.fit_transform(x)
sns.scatterplot(embedding[:,0], embedding[:,1], hue=label['Class'], legend='full',ax=ax3)

plt.show()
I get this :
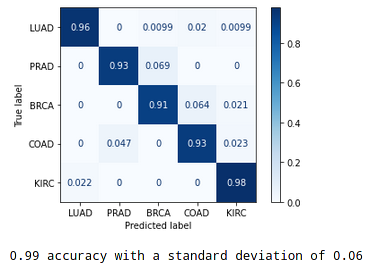
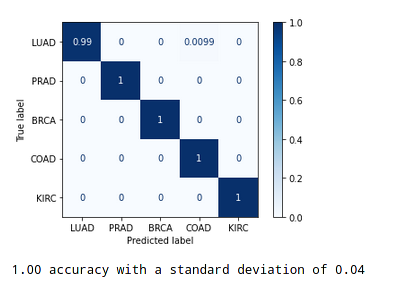
As i want to create a classification model I start by using a decision tree, from looking at the PCA it seems that the data are non-linearly separable so I expect the decision tree to perform better than logistic regression :
# Create training and testing datasets
train_features, test_features, train_labels, test_labels = train_test_split(df, list(label.Class), test_size = 0.33, random_state = 42)

# Create and fit decision tree
clf = tree.DecisionTreeClassifier(max_depth=depth, min_samples_leaf=min_leaf)
clf = clf.fit(train_features, train_labels)

# predict
predicted_label = clf.predict(test_features)

# present results
plot_confusion_matrix(clf, test_features, test_labels,
                                 display_labels=list(set(list(label.Class))),
                                 cmap=plt.cm.Blues,
                                 normalize='true')

# print accuracy
scores = cross_val_score(clf, x_marker_100, list(label.Class), cv=300)
print("%0.2f accuracy with a standard deviation of %0.2f \n \n \n" % (scores.mean(), scores.std()))
print(classification_report(test_labels, predicted_label))
but when I try the logistic regression using the following code :
# Create training and testing datasets
train_features, test_features, train_labels, test_labels = train_test_split(df, list(label.Class), test_size = 0.33, random_state = 42)

# Create and fit decision tree
clf = LogisticRegression().fit(train_features, train_labels)


# Predict
predicted_label = clf.predict(test_features)

print(confusion_matrix(test_labels, predicted_label))
print(clf.score(test_features, test_labels))
# present results
plot_confusion_matrix(clf, test_features, test_labels,
                                 display_labels=list(set(list(label.Class))),
                                 cmap=plt.cm.Blues,
                                 normalize='true')
plt.show()
# print accuracy
scores = cross_val_score(clf, x_marker_100, list(label.Class), cv=300)
print("%0.2f accuracy with a standard deviation of %0.2f \n \n \n" % (scores.mean(), scores.std()))
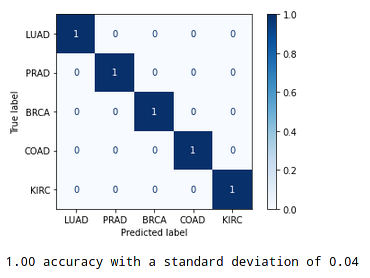
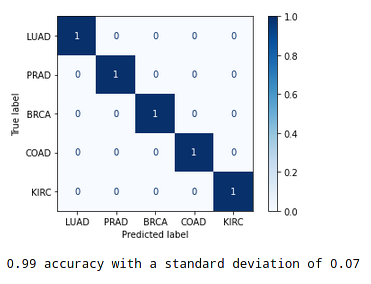
I get the following confusion matrix :
Does this mean that, unlike what i thought from looking at the PCA, my data is linearly separable ? Or is there a problem in the code ?
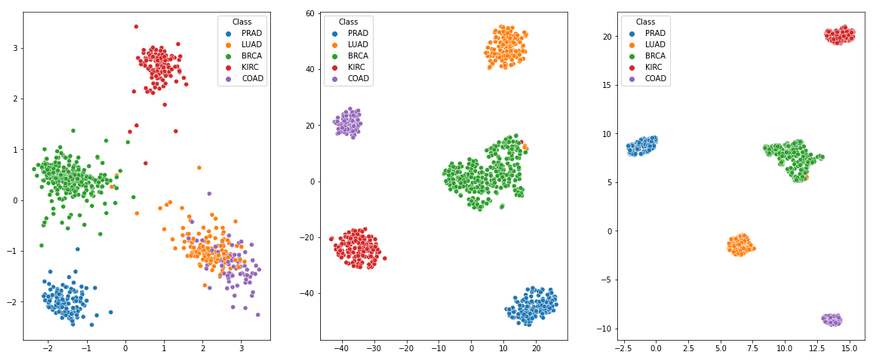
After doing some feature extraction (going from 20 000+ genes to only 10) PCA seems to show that the problem is almost linear now :

