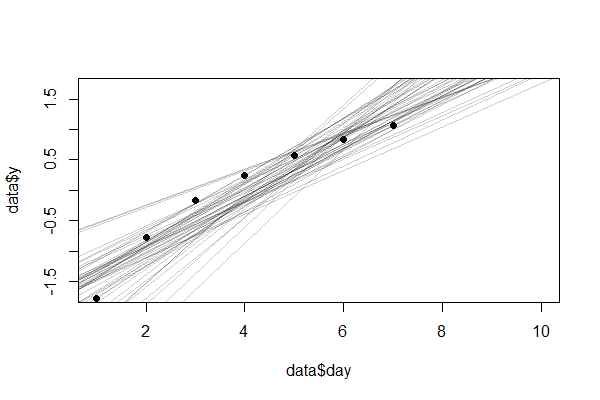
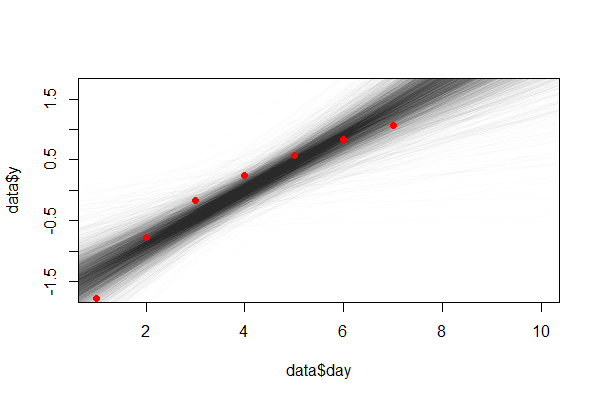
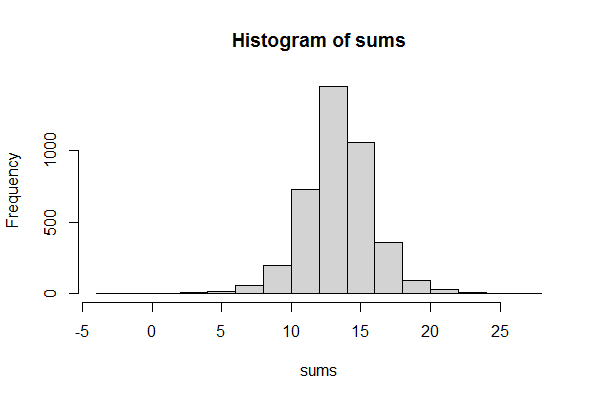
Let's say I have some value y for the first 7 days (day). I want to predict sum(y) after n days (a couple of weeks) and also get its distribution. (Note that days are already logged and scaled (scale(log(day))).
I'm interested in the Bayesian approach (I already found the same problem solved by frequentists) and I would appreciate an intuitive explanation and, if possible, solve it with as little math as possible (I prefer to simulate.:)). I don't mind if you use any other R package to implement the solution (tidybayes, ...) or just explain it.
library(rethinking)

# both columns are already logged and normalized - the reason days are not  integers
data <- tibble::tribble(
    ~day,                 ~y,
    -1.77840188804283,   1.59343897400421,
    -0.766238080609954,   1.26984673633088,
    -0.174160208674574, -0.369170057608193,
    0.245925726822919,  -0.65694469801144,
    0.571769693063722, -0.523623000175519,
    0.838003598758299, -0.924816393618227,
    1.06310115868241, -0.388731560921705
)

model <- quap(
    alist(
        y ~ dnorm(mu, sigma),
        mu <- a + b * day,
        a ~ dnorm(0, 0.1),
        b ~ dnorm(-1, 0.5),
        sigma ~ dnorm(0, 0.2)
    ),
    data = data
)
How to get the distribution of sum of predictions? This is: how is distributed sum(y) for the first n days?


sum(y)for the firstndays? $\endgroup$ndays" meant ifdayswas discrete, e. g. ranged from1:7, but with the given days in between -1.78 and 1.063 it appears to be some continuous value and those do not have firstnvalues. $\endgroup$log(day)and normalized them afterward. Sorry if I wasn't clear. $\endgroup$