0
$\begingroup$

Hope we are all safe, well and happy

I have a question that on the surface likely seems very trivial, but the empirical observations are not matching what should (in my head) theoretically happen. I suspect a very strong reason for this is the fact i'm very much a newbie in the stats space.

Background

Lets say I wish to use a linear regression equation to predict the maximum load (in kg/lbs) that an individual can lift using the velocity measured at i different submaximal loads (also recorded in kg/lbs). At present, one of the proposed practices is that you use only 2 loads, which are spaced as far apart on the sample space as possible (e.g., (1) 20% of the individuals maximum and (2) 80% of the individuals maximum. Once we have our regression we then extrapolate to a velocity value thought to correspond to an individual's maximum load. This can be done using either a pooled value (i.e., the mean velocity recorded during a maximal attempt across lots of individuals) or an individualised value (the actual value measured during a maximal lift). When using the individualised value, the assumption is made that this value is unique for each individual, but that it remains relatively stable. It's important to stress here that this regression is built for each person individually, and the goal is not to generalise. It is not for inferential purposes and it is not for hypothesis testing. It is simply to try and predict, for that specific individual, what load represents their maximum on a given day.

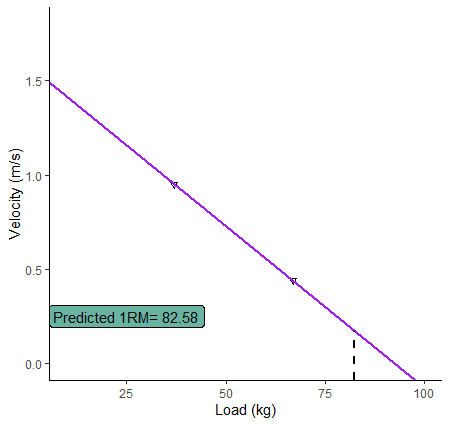
So, we get someone to come in, we load up the barbell incrementally until we reach their maximum. We then select the observations that represent 20% and 80% of that individuals maximum and create a linear model with these. Clearly, we get a regression that fits the observed data perfectly with R^2 =1 and RMSE=0. I have attached a very rudimentary illustration of what I mean below. Although these are observed values and do not represent that individuals true "performance", they are the "true" values for that given day, so to speak. Theoretically then, the biggest influence on our prediction should be our choice of the 'x' or the 'velocity' value used to represent that individuals maximum.

here

Question

If I use the group value and this =/= that velocity that corresponds to that individual during a maximal attempt, then the prediction will clearly be off. However, if that individuals actual velocity value for a maximum load on a given day were to be used (for example, if we had conducted the test above and retrospectively fit the model to the observed data, we would know the "truth") should the generated prediction and actual value not be exactly equal? I know this would not work prospectively though (when we do not know the "true" value.

To spin this another way: if we were to create a model with >2 loads, then we would have error due to regression (i.e., the line of best fit does not fit observed values perfectly) as well as error due to extrapolation. But with only 2 loads, this is not a factor. Again, note that the point is to predict the maximum load that a given individual can lift in a given training session or instance.

Hopefully that makes sense, but let me know if you need any clarification. This is just a generic question based on my very limited understanding. PS: I'm also not advocating that these practices are a good idea.... It's just what's done. Take from that what you will. Thanks in advance for any help!

$\endgroup$

1 Answer 1

0
$\begingroup$

The likely problem here is your assumption that there is a linear relationship between load (force against which the muscles are contracting) and velocity. Your linear model is probably not appropriate for these force-velocity curves.

At the single-muscle level, A. V. Hill showed over 80 years ago that the force-velocity relationship is hyperbolic, not linear. Later, that behavior was shown to be based on the fundamental molecular processes underlying muscle contraction. There's a sketch of a typical force-velocity curve on this page. It's not like the descending straight line that you show. Things are more complicated when there are multiple muscles working together, as in your study, but I suspect that the principle is the same.

It's always a good idea to challenge the hypothesis of linearity when you develop a linear model. In your case you can do this directly: don't just look at the maximum and two intermediate loads, but look at a whole range of loads from very light to nearly maximum. Do you see a linear relationship as you have assumed, or a hyperbolic relationship as in the links above?

You could even use the data you already have to get at the linearity assumption within individuals, if you have confidence in your estimate of the maximum load. You don't just have 2 data points per individual, at 20% and 80% of the maximum--you also have a data point at the maximum, 0 velocity at that maximum load. I suspect that you won't find a simple linear relationship when you include all 3 data points, and that estimates of the individual maximum load based only on the 20% and 80% values will tend to underestimate the true maximum load.

It's possible, however, that the discrepancies from linearity will be small enough not to matter in practice. That brings up another important point: your statistical analysis must be combined with your knowledge of the subject matter to determine what is useful in any practical application. What's statistically significant is not necessarily significant in practice.

$\endgroup$
2
  • $\begingroup$ Hi and thanks for your excellent response! Sorry I should have clarified, this was more of a generic question than a question based on data I have collected. You're right A.V. Hill was a pioneer, and that relationship between force (newtons) and load does follow more of a hyperbolic curve at the single muscle level- of course this is also dependent on muscle morphology. Interestingly, in multi-joint movements there are a wealth of studies that indicate this relationship is actually fairly linear in nature. But I agree: This assumption should really be the first assessed (reducible error)! $\endgroup$ Commented Feb 21, 2021 at 22:39
  • $\begingroup$ I also wanted to say you've hit the nail on the head RE practical significance. Even if predictions are off, if the difference between actual and predicted is less than more common methods, then it's a win. Setting a 'practical signifcance' threshold is a can of worms all of it's own. But the bar to clear here would be (a) errors less than current methods and (b) how is the error scaled relative to the smallest adjustment in load lifted you can make? If it is smaller than this, it has no meaning for your prescription; there's nothing you can do! $\endgroup$ Commented Feb 21, 2021 at 22:56

Your Answer

By clicking “Post Your Answer”, you agree to our terms of service and acknowledge you have read our privacy policy.

Not the answer you're looking for? Browse other questions tagged or ask your own question.