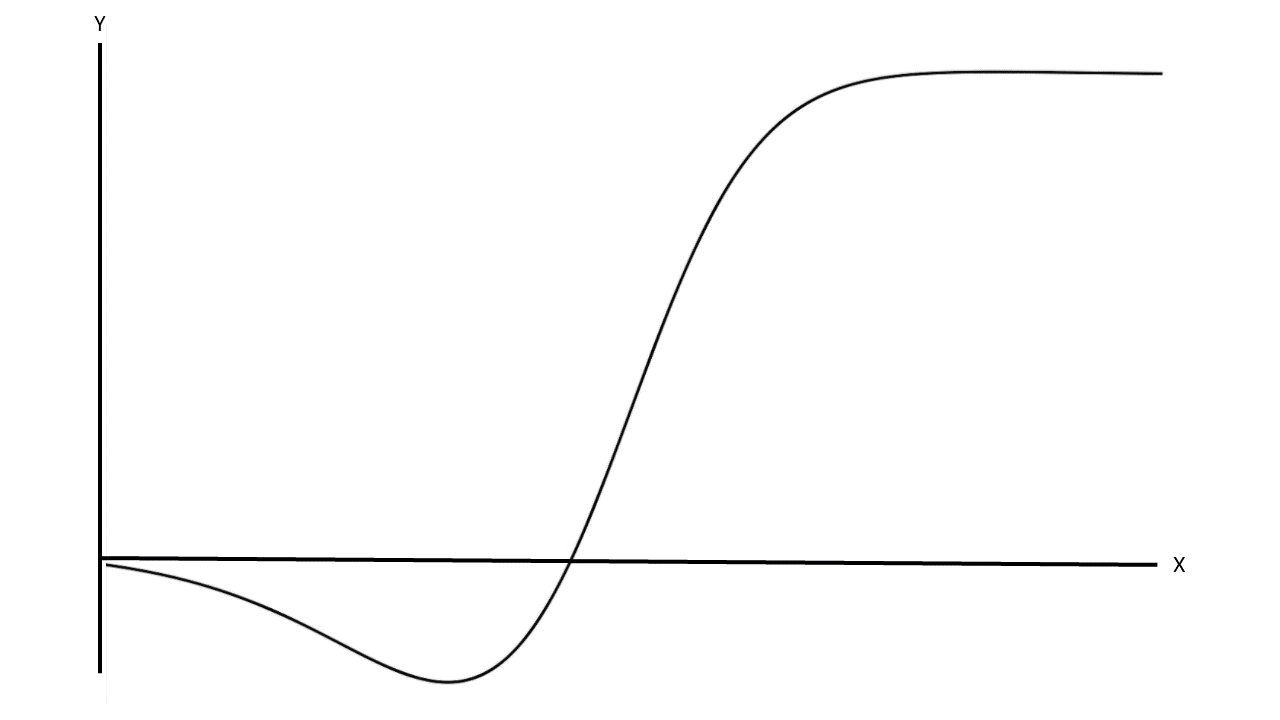
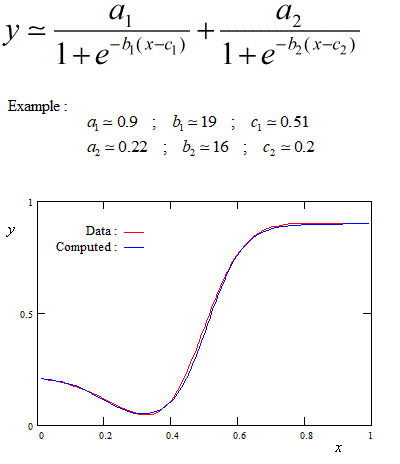
Would like suggestions on how to model data that looks somthing like this. Need to be able to predict at higher values of X where the curve is relatively flat, slightly increasing, and certainly not decreasing. The key thing that I am having trouble fitting well is the initial drop/hook. If this was absent, a lot of S-shaped curves would work. The initial hook is proving hard to model well. Of course a GAM or similar is possible, but not sure how it will predict beyond the range of observed data. Any suggestions?
The real data that I am trying to model and that I think should follow a distribution/curve something like that noted above are shown here:
X = 0:51
Y = 0, -0.004, -0.006, -0.011, -0.014, -0.019, -0.024, -0.026, -0.028, -0.03, -0.03, -0.03, -0.03, -0.03, -0.03, -0.027, -0.023, -0.02, -0.016, -0.011, -0.009, -0.007, -0.005, -0.003, -0.001, -0.001, -0.003, 0.005, 0.007, 0.003, 0.005, 0.006, 0.005, 0.01, 0.016, 0.02, 0.017, 0.015, 0.013, 0.012, 0.016, 0.021, 0.01, 0.02, 0.03, 0.03, 0.031, 0.026, 0.027, 0.027, 0.028


