0
$\begingroup$

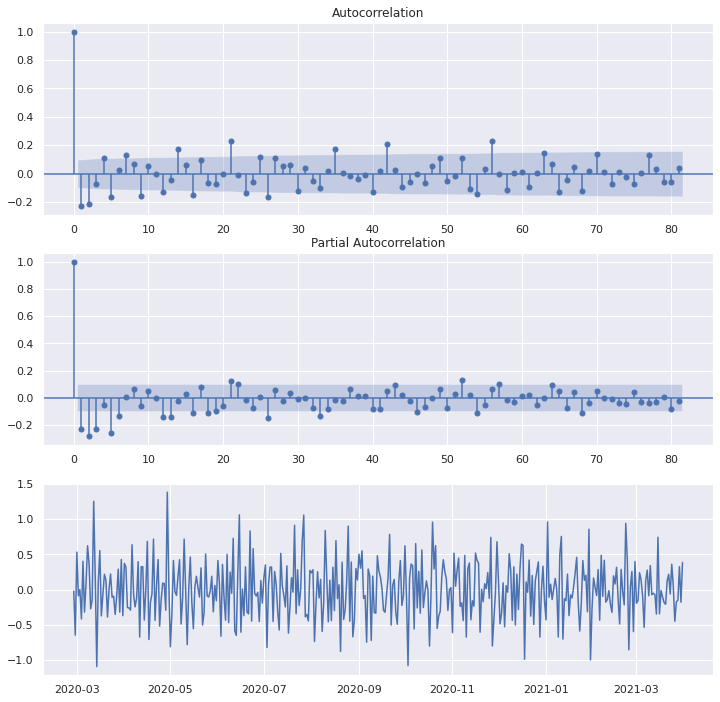
I'm a fairly new one to time series analysis. I was analyzing the daily trading volume of stock derivatives for the past year and trying to see if there is a seasonality pattern. I tried to make the time series stationary by doing a log transformation and shifting it by 7 days. I chose lags value by referring to this post. These are the plots I got after performing ACF and PACF, the plot on the bottom is the log-transformed volume shifted by one week.

enter image description here

However, I am confused by how should I interpret the results. Does it imply that there is a pattern occuring every 21 days? Or am I missing something while performing an analysis?

$\endgroup$
5
  • $\begingroup$ What do you mean by shifting by 7 days? It looks like this way you have introduced autocorrelation at lag 7, 14, 21, 35, 42, 56, 63, 70, 77 -- all multiples of 7. $\endgroup$ Commented Apr 2, 2021 at 15:03
  • $\begingroup$ I tried to make the series stationary, because my log-transformed series still wasn't stationary, so I used the following code: log_diff = fv['log'].diff()[7:] $\endgroup$ Commented Apr 5, 2021 at 1:15
  • $\begingroup$ Well, I am not sure what this code does, but it looks like it differences the series. Perhaps at lag 7, perhaps not. $\endgroup$ Commented Apr 5, 2021 at 3:01
  • $\begingroup$ Yes, it does difference the series because there was a seasonality appearing every week, so I tried removing it. However, even after differencing the weekly lag persists. Does that mean that I have a weekly cycle in my time series? $\endgroup$ Commented Apr 5, 2021 at 3:46
  • $\begingroup$ I guess it does, though I would only be confident differencing a series if it has a unit root. Otherwise you end up overdifferencing it (you may look up the keyword). $\endgroup$ Commented Apr 5, 2021 at 3:51

0

Your Answer

By clicking “Post Your Answer”, you agree to our terms of service and acknowledge you have read our privacy policy.