0
$\begingroup$

I am new to machine learning and having some trouble making sense of the results I am getting from grid search.

I am working on a supervised binary classification problem with a small dataset (109 samples). I selected a few models to test and am using a cross-validated grid search to identify the hyperparameters that yield the greatest AUC. Wen I plot learning curves on the training data using the tuned models, I see that there is severe overfitting with a very good training score and much poorer cross validation score. The overfitting isn't too surprising given the small sample size.

What I'm confused about is why the grid search didn't select parameters to reduce overfitting that were provided in the parameter grid. For example, in the case of MLP, the grid included a smaller hidden layer size and greater L2 penalty than what was selected. In the case of KNN, a relatively small K value was selected from the grid.

$\endgroup$
1
  • $\begingroup$ This is more a question of how your grid search was implemented than an actual statistics question. $\endgroup$ Commented Apr 26, 2021 at 0:32

1 Answer 1

1
$\begingroup$

why the grid search didn't select parameters to reduce overfitting that were provided in the parameter grid

Most likely because you did not (sufficiently) penalize overfitting when setting up the optimization target functional/figure of merit.

Overfitting means that the models become unstable. That is, slight changes in the training set lead to large changes in the model and its predictions (e.g. for the same test case). Overfit models perform worse than models with optimal complexity on average, but there is large variations around this average.
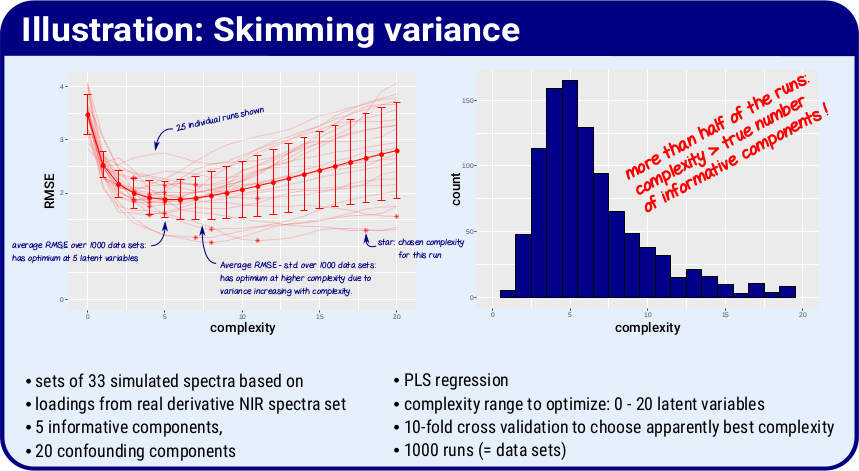
When selecting the apparently best model based on observed error, you run a risk of "skimming" this variance, i.e. selecting hyperparameters as optimal which only accidentally look that good. This risk increases with increasing variance (both due to model instabiliy and due to small test sample size) and with increasing number of models that is compared.

Here's a simple simulation that illustrates the effect:

skimming variance

source: C. Beleites and A. Krähmer: Cross-Validation Revisited: using Uncertainty Estimates to Improve Model Autotuning, Poster, FTIR Workshop, Robert-Koch-Institute, Berlin, Germany, 2019.

One heuristic that counteracts this effect is the one-std-rule from the Elements of Statistical Learning: take the apparent optimum and estimate variability at this complexity (they do this by measuring standard deviation across e.g. 10 folds of cross validation). Then select the least complex model that is within one standard deviation of the apparent optimum. While this heuristic does not separate the underlying causes (small test sample size vs. instability) of the variance, and thus depends on the actual set-up of the cross validation, it is a good starting point.

$\endgroup$

Your Answer

By clicking “Post Your Answer”, you agree to our terms of service and acknowledge you have read our privacy policy.

Not the answer you're looking for? Browse other questions tagged or ask your own question.