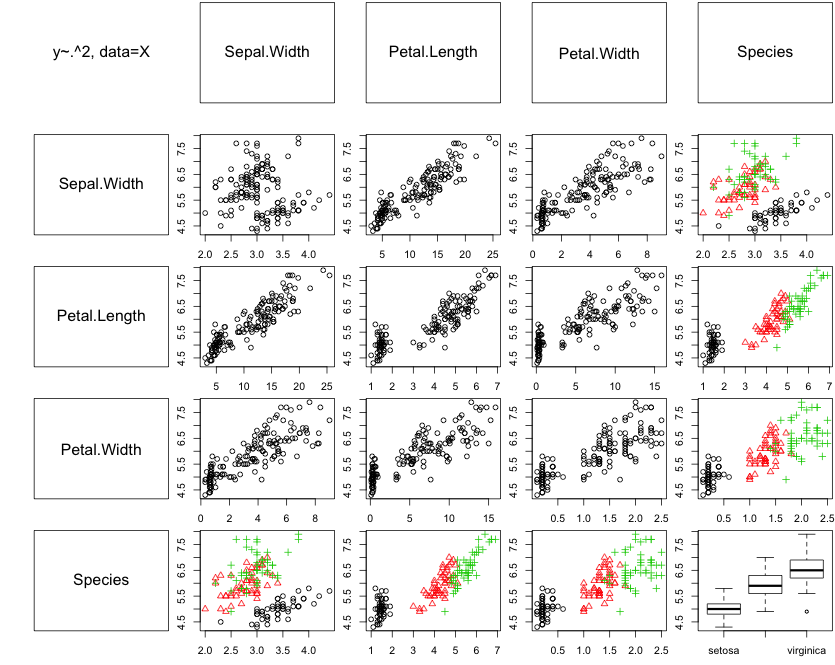
Here is a small function, which only uses base functionality. I don't know it it is sufficiently simple for your course.
regplots <- function(y,X) {

  old.par <- par(no.readonly = TRUE)
  on.exit(par(old.par))
  par(mfrow=c(ncol(X)+1,ncol(X)+1),
      oma=rep(0.2,4),
      mar=c(2.5,2.5,0,0))

  combs <- expand.grid(names(X),names(X))
  a <- matrix(combs[,1],ncol=ncol(X))
  b <- matrix(combs[,2],ncol=ncol(X))

  plot.new()
  text(0.5,0.5, "y~.^2, data=X",cex=1.5)

  for (i in seq_len(ncol(X))) {
    plot.new()
    text(0.5,0.5, names(X)[i],cex=1.5)
    box()
  }

  for (i in seq_len(ncol(X))) {
    plot.new()
    text(0.5,0.5, names(X)[i],cex=1.5)
    box()
    for (j in seq_len(ncol(X))) {
      if (i==j) {
        x <- X[,a[i,j]]
        plot(x,y,xlab="",ylab="")
      } else {
        x1 <- X[,a[i,j]]
        x2 <- X[,b[i,j]]

        testx1 <- is.numeric(x1)
        testx2 <- is.numeric(x2)

        if (!testx1 & testx2) plot(x2,y,xlab="",ylab="",pch=as.numeric(x1),col=as.numeric(x1))
        if (testx1 & !testx2) plot(x1,y,xlab="",ylab="",pch=as.numeric(x2),col=as.numeric(x2))
        if (!testx1 & !testx2) boxplot(as.formula(y~x1+x2))
        if (testx1 & testx2) {
          x <- x1*x2
          plot(x,y,xlab="",ylab="")
        }
      }
    }
  }
  invisible()
}


regplots(y=iris[,"Sepal.Length"],X=iris[,names(iris)!="Sepal.Length"])
You only asked for the plots on the diagonal, but I like to include first order interactions. It should be easy to simplify the function to show only the main effects.


