I want to calculate the quantiles of a t distribution and a normal distribution fitted to my data (can be found here: http://uploadeasy.net/upload/nk0f.rar).
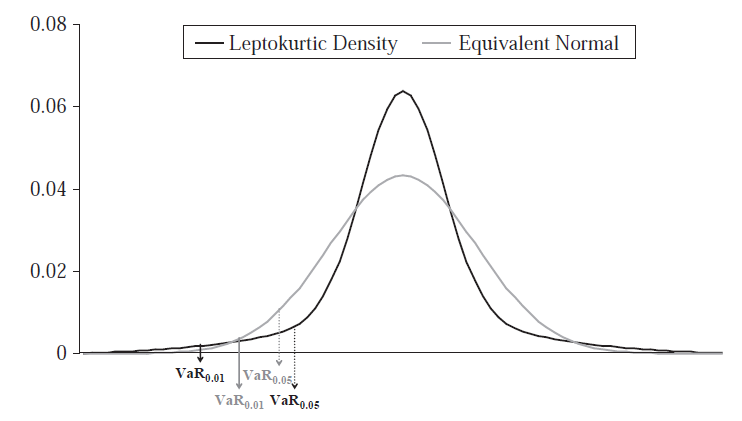
The t distribution is leptokurtic, therefore there will be an area, where the quantile of the t distribution is larger than the quantile of the normal distribution for the same probability level. Then there will be a threshold, at which they are the same and then an area, in which the quantile is smaller. Consider this picture:

Ignore the "VaR" and read it as a quantile: At 0,05, the quantile of the leptokurtic density is smaller thant the quantile of the equivalent normal distribution. At 0,01 the quantile of the leptokurtic density is larger. I want to find this threshold. I am looking at the right side of the distribution. My code for calculating the quantiles refers to a special probability level. My questions are:
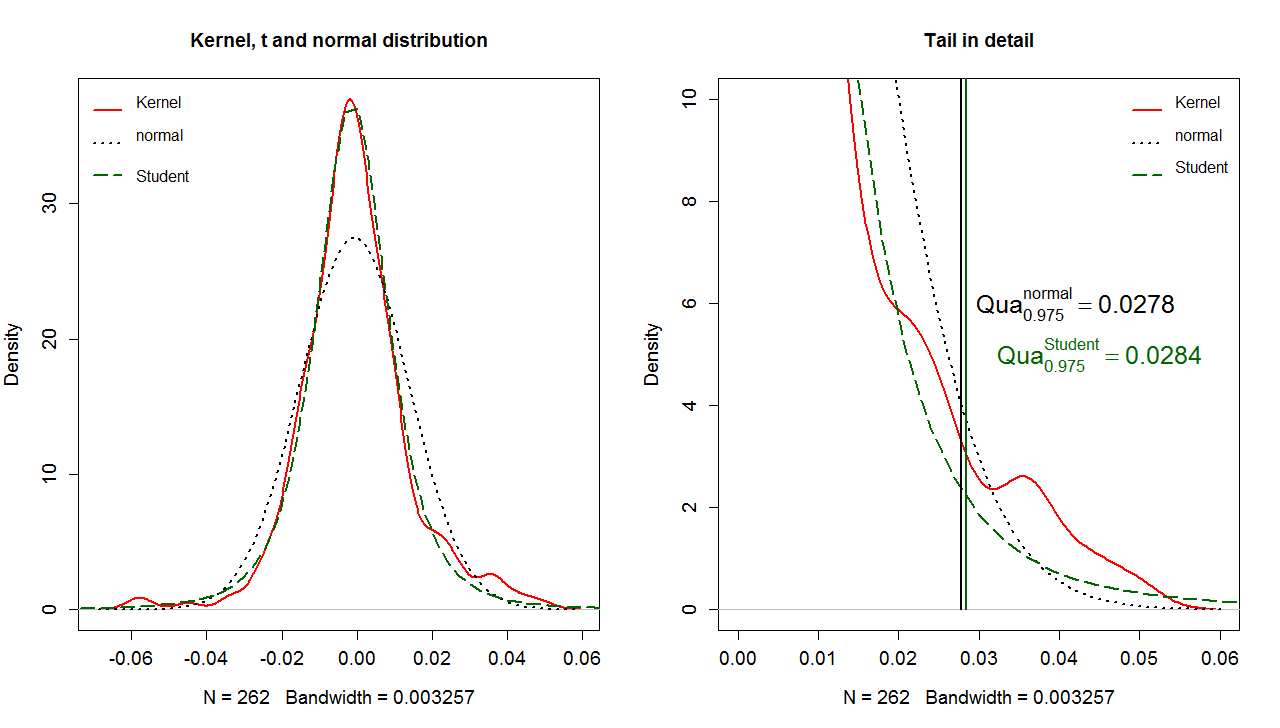
- Are my calculations correct? Especially the plot?:
- How can I get the threshold value?
I am wondering about the following: The threshold value is NOT at the intersection of both densities at the tail right?
My code gives the following picture:

I mean, is it correct, that the quantile of the t distribution is larger than the quantile of the normal distribution if a probability level is considered, which leads to quantiles before the intersection? Yes, I think so?! But the intersection is not the threshold right?! In this case, the threshold where the quantile of the t distribution is larger than the quantile of the normal distribution lies before the intersection point, does this always hold?
