1
$\begingroup$

For a disease classification problem I have trained a deep learning model to predict the probability score of the disease based on images only. During training time I had access to labeled images only without any other patient related data. The model gives a probability score (in range 0 to 1) based on an input image. Now, I want to make the prediction more robust by incorporating expert knowledge as a subjective probability. For that reason we have created a set of questionnaires that will be asked to the patient to assist the image based analysis. We have collected opinion from human experts (doctors) and they already assigned weights to the answers (in range [-1,3], where, -1 means low probability of the disease, 3 means high probability). A sample is shown in following table:

enter image description here

Now, during actual classification I can get a weighted value based on the answer of the user using following equation:

enter image description here

where, Symptom can be either 0 or 1 (present or absent). The result will be in the range [-1,3], but I want to convert it to a probability score in the range [0,1]. Is it sufficient to convert the obtained value to [0,1] range using:

OldRange = (OldMax - OldMin)  
NewRange = (NewMax - NewMin)  
NewValue = (((OldValue - OldMin) * NewRange) / OldRange) + NewMin 

Or is there any other better approach? So, in the end, I want two probabilities: one from image based deep learning model, another from subjective expert knowledge based on questionnaires and make the final prediction based on these two probabilities. Thanks in advance for your feedback.

$\endgroup$
6
  • 1
    $\begingroup$ You need some information to connect an expert's "weight" to probability: otherwise, you're just making stuff up. What form would that information take in your application? $\endgroup$
    – whuber
    Commented Jul 12, 2021 at 13:42
  • $\begingroup$ There are some questions that will be asked to the users and doctors already assigned weights to the answers (-1 low probability, 3 high probability). Now, I want to give the user a single probability score for the disease (in range 0 to 1). Hope I could make it clear. $\endgroup$ Commented Jul 12, 2021 at 13:48
  • 2
    $\begingroup$ You do: the point is, that's its clear you don't have information about objective probabilities. You have instead a set of qualitative, subjective scores. No algorithm can reliably tell you how those scores translate into something objective: you need actual data about probabilities. Otherwise put, you need to calibrate your experts. $\endgroup$
    – whuber
    Commented Jul 12, 2021 at 13:51
  • 2
    $\begingroup$ @whuber Thank you for your explanation. Actually I want to use these information to assist a deep learning based image analysis model. So, I already have a score from the deep learning model and want to make it more robust using these extra information. Can I treat this score as a subjective probability to assist the diagnosis or should I ask the doctors to define the probability range for their score (like -1 to 0 : maybe 0.25 probability and so on)? Thanks again for your time. $\endgroup$ Commented Jul 12, 2021 at 14:01
  • 1
    $\begingroup$ @FrozenKing could you edit the question and add those details to the question? What exactly is the data that you have? You have the answers to the experts rating of the symptoms of the patients using a severity scale, the images, and the labels..? Could you give an example of such data (could be few lines of made-up data)? $\endgroup$
    – Tim
    Commented Jul 12, 2021 at 14:17

1 Answer 1

2
$\begingroup$

The numbers you have are meaningless. It is a well-known fact that people when asked to rate something do this subjectively. It was researched by economists studying utility of the money. In the case of money, the same amount of money would mean different things to different people, but also the utility of the money does not raise linearity with the amount of money. A similar phenomenon was observed for probabilities. People differ in what they consider as "high" or "low" probability. Below you can see a plot summarizing one of the studies asking people to name the probabilities, as you can see, the answers vary a lot.
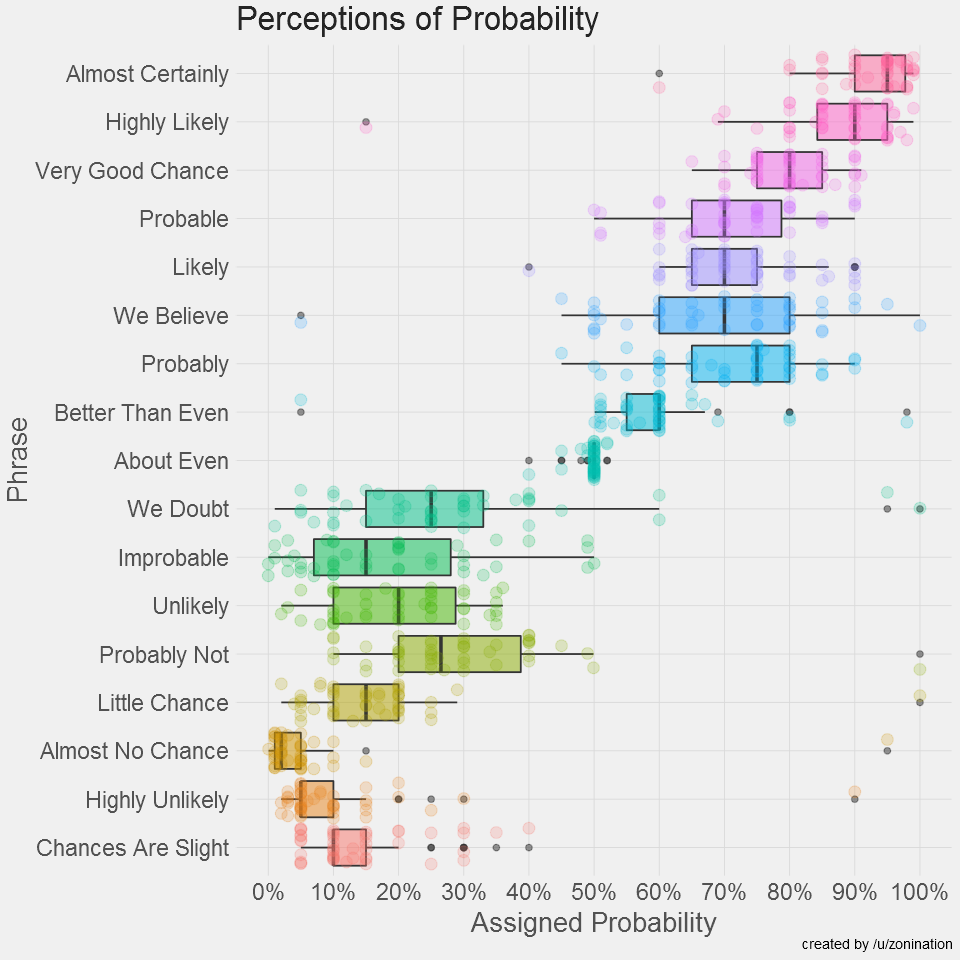
Plot showing perceptions of probabilities mapped to numerical values.

You may argue that in your case you have the -1 to 3 scale, but the same problem remains since you do not have any unambiguous mapping from the numbers to actual probabilities. This can't be done by averaging, or taking a weighted sum of the numbers.

What you can do is to use a statistical model that would map the ratings to the probabilities. A class of such models was proposed by psychometrists and is called Item Response Theory. A typical use case of such models is when you have multiple students taking an exam, where the exam sheets are each rated by multiple raters. The simplest IRT model is the Rasch model, where the $i$-th student's response, rated by $j$-th rater is modeled by considering the student's ability $\theta_i$ and the rater's tendency $\beta_j$ to over- or under-estimate.

$$ P(X_{ij} = 1) = \frac{\exp(\theta_i - \beta_j)}{1-\exp(\theta_i - \beta_j)} $$

Such a model lets you find the "true" ability $\theta_i$. When considering your data you need a model that is able to do something similar.

In practice, what this means for you is that you want your algorithm to learn the weights when taking a weighted sum of the ratings of the symptoms. You don't only want to assign different weights for each symptom, but also, similar to in the Rasch model, you want the algorithm to be able to correct for the tendencies of the individual experts to over- or under-estimate the probabilities. The simplest case is considering the relationships between those parameters as a linear function, but one can easily imagine how the mappings between the ratings could have different non-linear forms for different experts (e.g. a person who marks everything in black-and-white categories where everything is either low probability or high probability).

You can do this by building a model that predicts the presence or absence of the disease based on all the ratings of the experts of the symptoms.

The question remains, how do you want to "incorporate" those probabilities into the model? You could either (1) have a separate model that translates the ratings to probabilities and uses those probabilities as a feature, or (2) have the raw answers by the experts as inputs to the model along with the images so that the model does both the weighting and classification, or (3) make your model predict the probabilities instead of labels, (4) or use the probabilities as weights (as in survey weights) for the labels. Notice that in (1)-(2) to make predictions from the model you would need not only the images but also the ratings, so the model stops being an image classifier. In (3)-(4) you are making an assumption that the ratings by the experts are more valuable than the labels themselves, or at least that they bring additional value to the labels. For example, someone judged by the expert as having a higher probability is considered as "sicker" as compared to a person with a positive label but judged as having a small probability--in such a case, your model can accidentally learn to copy the biases that the experts have and learn to misclassify "strange" cases.

I'm not giving you here the final answer on how to do this. It is your decision and it needs an additional, in-depth understanding of your data and the problem you are trying to solve. As said above, there is no single way how this could be solved as well. It is worth noticing that you have three non-trivial problems to solve here: how to use the information from the raw ratings by experts (psychometrics), how to classify the images (image classification), and how (or if) the two can be combined (problem definition, model architecture).

$\endgroup$
5
  • $\begingroup$ Thank you very much for this insightful and elaborated answer. It's not possible to collect raw expert's rating corresponding to each training image as I only have training images without any additional information. I'm making a pre-scanner application just to give the user an opinion (doesn't need to be foolproof). So, the main analysis is going to be based on the analysis of the image. To give the user insight from a different perspective I'm planning to show a result from expert's opinion. Both the results can be presented to the user without merging. $\endgroup$ Commented Jul 12, 2021 at 17:34
  • $\begingroup$ So, my problem boils down to how can we summarize a score from pre-assigned weights by the experts without any training data. I'll try to study the resources you mentioned. Thank you again for your time @Tim. $\endgroup$ Commented Jul 12, 2021 at 17:36
  • 1
    $\begingroup$ @FrozenKing but you need a way to connect those expert weights with the labels, otherwise they’d be useless. You can use a Rasch-like model where you predict the weight given by expert based on two parameters: one for each expert, & one per each symptom—but this only cleans the biases by experts, doesn’t convert anything to probabilities, as you don’t have relevant data to do this. $\endgroup$
    – Tim
    Commented Jul 12, 2021 at 18:46
  • $\begingroup$ I'll read in depth about Rasch model, as I don't have enough knowledge about these topics. In the meantime, is it a wrong approach to mimic how the doctors take decision based on symptoms? Is it okay if the doctors define the probability range for their score (like -1 to 0 : maybe 0.25 probability and so on? -mentioned in a previous comment- )? $\endgroup$ Commented Jul 13, 2021 at 2:58
  • 1
    $\begingroup$ @FrozenKing sure, you can ask the doctors to use numbers in (0, 1) instead [-1, 3], then you don't have the problem of translating them to a completely different scale. If you ask them for ranges, how exactly would you use this information with your model? I see no easy way to use such information. Moreover, this wouldn't do anything about correcting the biases of the estimates by experts and you still need a way of aggregating them. So it wouldn't solve your problem, just fix a small part of it--having a wrong scale for the values. $\endgroup$
    – Tim
    Commented Jul 13, 2021 at 6:09

Your Answer

By clicking “Post Your Answer”, you agree to our terms of service and acknowledge you have read our privacy policy.

Not the answer you're looking for? Browse other questions tagged or ask your own question.