1
$\begingroup$

I am working with the R programming language. Suppose I have 1000 patients in a medical study, and I want to take measurements on these 1000 patients.

  • 500 patients in Group A
  • 250 patients in Group B
  • 250 patients in Group C

However, I don't have enough money to study all these patients.

I found the following tutorial in R: https://www.programmingr.com/examples/neat-tricks/sample-r-function/how-to-seize-pwr-statistical-power-analysis-in-r/

library(pwr)
pwr.2p.test(n=1000,sig.level=0.05,power=0.5)


     Difference of proportion power calculation for binomial distribution (arcsine transformation) 

              h = 0.08764393
              n = 1000
      sig.level = 0.05
          power = 0.5
    alternative = two.sided

Question: I am not sure if this is the correct way to select sample size? Does anyone know if it is possible to find out the minimum number of patients need to be selected from Group A, Group B and Group C for the results to be statistically significant? I read something about how this would involve "significance" and "power".

Can someone please show me how to do this?

Thanks!

$\endgroup$
3
  • 1
    $\begingroup$ You can't guarantee that the results would be significant. You can say that if the population (true) effect is of a certain magnitude, you have an X percent chance of getting a statistically significant result (that's power), with a sample size of Y. Power of 0.5 is low. $\endgroup$ Commented Oct 14, 2021 at 2:34
  • 1
    $\begingroup$ The formula (or software) that you use to determine the sample size depends directly on the test that you want to perform, i.e. the objective of your study. I encourage you to edit your question and clarify the purpose of your study (for example, you mentioned measurement, which made me think of comparing means but the provided R code is for proportions). $\endgroup$
    – Pitouille
    Commented Oct 14, 2021 at 5:12
  • $\begingroup$ when it comes to $\infty$ the game changes math.stackexchange.com/questions/4358766/… $\endgroup$
    – BCLC
    Commented Jan 18, 2022 at 0:37

1 Answer 1

1
$\begingroup$

Forgive me if it seems too trivial sometimes but I feel there are some confusions...

Sample size formula

First, it starts with a question that you want to answer: you may want to compare the difference of means in 2 groups or comparing proportions (to keep it simple). This will lead to a specific test statistic, which, in turn, will lead to a specific sample size formula.

Factors involved in the calculation of the sample size

In your example, you mention a medical study of 1000 patients. This is not a factor that is considered in the type of tests covered by the pwr package. Basically, you want to determine the size of the sample that will allow you to detect an effect under certain conditions. This is independent from the size of the underlying population.

The factors that are considered when using such functions are:

Back to your questions

Is it the correct way to select sample size?

No, when you use this type of tools, the argument that you omit to pass is the one you are interested in. So, to get the information about the sample size, n must be blank.

It is possible to find out the minimum number of patients required in each group?

Most of the time, pwr gives you one unique n for both groups. However, pwr.2p2n.test can take in argument n1 and will return the required size for n2... but this is the only exception (to my knowledge)

I read something about how this would involve "significance" and "power"

Yes, both influence the calculation of the sample size. If we take the example we had in the previous answer, i.e. :

pwr.t.test(d=.5, sig.level=0.05, power=0.8, alternative="two.sided")

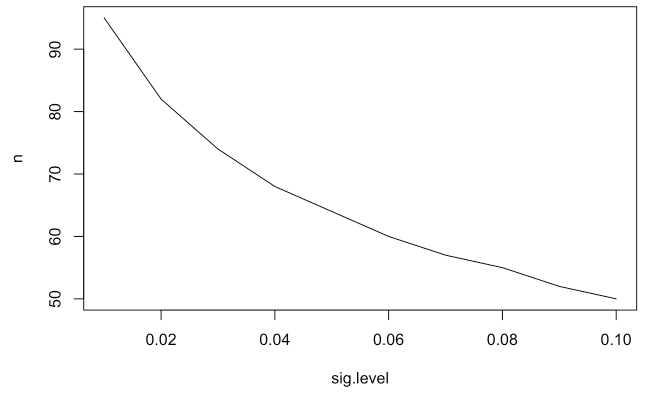
and play with the significance level (only sig.level change, the other remain fixed):

enter image description here

You can see that sample size requirements decreases as significance level increases (as expected)

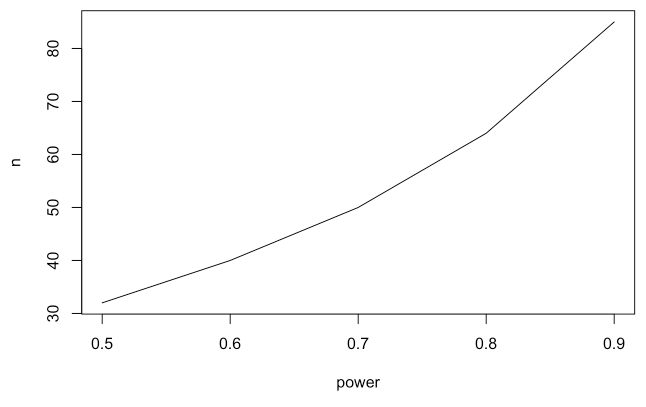
Finally, if we do the same exercise with power:

enter image description here

The sample size requirements increases as power increases.

Can someone please show me how to do this?

Probably if you tell us more about the test you want to perform ;-)

$\endgroup$

Your Answer

By clicking “Post Your Answer”, you agree to our terms of service and acknowledge you have read our privacy policy.

Not the answer you're looking for? Browse other questions tagged or ask your own question.