1
$\begingroup$

A few days ago I asked a question which had a programming error, I already corrected it and I bring it to you again. By generating $n=1,000,000$ of random data with normal distribution ($\mu=35, \sigma=4$) and calculating its estimators by MLE and MME. First load the library, I generate my random data and save it to a vector

library(EnvStats)


    rnorm(1000000, 35, 4)
c2<-rnorm(1000000, 35, 4)

To get the estimators use

enorm(c2, method = "mle")

and I get the following:

Results of Distribution Parameter Estimation
--------------------------------------------

Assumed Distribution:            Normal

Estimated Parameter(s):          mean = 35.00419
                                 sd   =  4.00252

Estimation Method:               mle/mme

Data:                            c2

Sample Size:                     1000000

My first question is, why does the "mle / mme" appear? In this case, is it the same to calculate the estimator by one of these two methods? My exercise asks me to use both methods to choose an unbiased estimator, what should I do?

If I do the same this time for a uniform distribution this time if I can calculate two estimators by both methods:

    runif(1000000, 50000,100000)
c<-runif(1000000, 50000,100000)
eunif(c, method = "mle")
eunif(c, method = "mme")

Results of Distribution Parameter Estimation
--------------------------------------------

Assumed Distribution:            Uniform

Estimated Parameter(s):          min = 50000.03
                                 max = 99999.99

Estimation Method:               mle

Data:                            c

Sample Size:                     1000000

Results of Distribution Parameter Estimation
--------------------------------------------

Assumed Distribution:            Uniform

Estimated Parameter(s):          min = 49980.71
                                 max = 99988.77

Estimation Method:               mme

Data:                            c

Sample Size:                     1000000

here I have a couple of doubts. If I must choose unbiased, the MLE estimator appears to be non-unbiased, am I correct? My second question is, having these two estimators, is there a function in R to calculate its MSE?

$\endgroup$
3
  • 1
    $\begingroup$ If you would like us to explain the output, please specify the code you used to get that output. I presume this was done with some function in an R package, so please show us what you used. Also, have you read the documentation for that function? $\endgroup$
    – Ben
    Commented Oct 26, 2021 at 23:31
  • 1
    $\begingroup$ ok, below I write the complete code $\endgroup$ Commented Oct 26, 2021 at 23:33
  • 1
    $\begingroup$ (1) For $n$ observations from a normal distribution the sample mean $\bar X$ is the MLE of the population mean; the method of moments estimator is also $\bar X.$ So the output shows mle/mme. (2) For estimation of the boundaries of a uniform distribution the MLE and MLE are not the same. A slightly simpler case is to estimate $\theta$ of $\mathsf{Unif}(0,\theta)$. The MLE is the maximum observation $X_{(n)},$ but it is biased (too small). the unbiased version is $\frac{n+1}{n}X_{(10)},$ which UMVUE. By contrast the MME is $2\bar X,$ which has a larger variance than either of the others. $\endgroup$
    – BruceET
    Commented Oct 27, 2021 at 2:37

1 Answer 1

1
$\begingroup$

Comment (2): For estimation of the boundaries of a uniform distribution the MLE and MLE are not the same. A somewhat simpler case than in your Question is to estimate θ of $\mathsf{Unif}(0,θ).$ The MLE is the maximum observation $X_{(n)},$ but it is biased (too small); the unbiased version is $\frac{n+1}{n}X_{(10)},$ which is UMVUE. By contrast, the MME is $2\bar X,$ which is unbiased, but has a larger variance than either of the others.

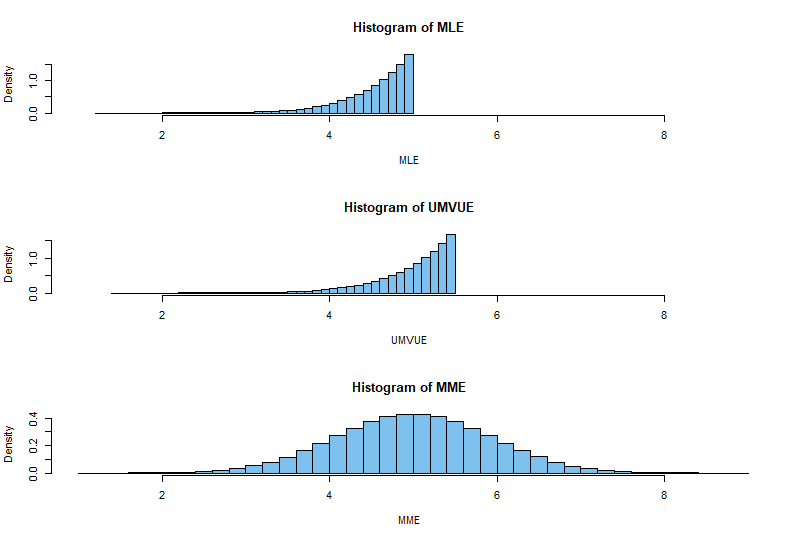
Here is simple R code to illustrate my Comment (2) for $\theta = 5, n = 10.$ My purpose is to illustrate some relevant facts about estimation from my comment, without getting into details of your R code for estimation.

One sample of size $n=10.$

set.seed(2021)
x = runif(10, 0, 5)
mle = max(x);  mle
[1] 4.914934
umvue = 1.1*max(x); umvue
[1] 5.406428
mme = 2*mean(x); mme
[1] 6.36967

Using a million samples of size $n=10$ to approximate means and standard deviations:

set.seed(1026)
MLE = replicate(10^6, max(runif(10,0,5)))
mean(MLE);  sd(MLE)
[1] 4.545056
[1] 0.4158174
UMVUE = 1.1*MLE
mean(UMVUE);  sd(UMVUE)
[1] 4.999562
[1] 0.4573992

MME = replicate(10^6, 2*mean(runif(10,0,5)))
mean(MME);  sd(MME)
[1] 4.999243
[1] 0.9107251

min(MLE,UMVUE,MME)
[1] 1.009347
max(MLE,UMVUE,MME)
[1] 8.872972
xl = c(1,8.9)
par(mfrow=c(3,1))
 hist(MLE, prob=T, br=30, col="skyblue2", xlim=xl)
 hist(UMVUE, prob=T, br=30, col="skyblue2", xlim=xl)
 hist(MME, prob=T, br=30, col="skyblue2", xlim=xl)
par(mfrow=c(1,1))

enter image description here

We compare root MSEs of the three estimators. By taking square roots, we use the units of the original data. Of the three estimators, the UMVUE has minimum RMSE (root mean squared error).

rmse.mle = sqrt(mean((MLE-5)^2))
rmse.mle
[1] 0.6163422

rmse.umvue = sqrt(mean((UMVUE-5)^2))
rmse.umvue
[1] 0.4573992  # smallest RMSE of the three

rmse.mme = sqrt(mean((MME-5)^2))
rmse.mme
[1] 0.910725   # unbiased, so RMSE is SD
$\endgroup$

Your Answer

By clicking “Post Your Answer”, you agree to our terms of service and acknowledge you have read our privacy policy.

Not the answer you're looking for? Browse other questions tagged or ask your own question.