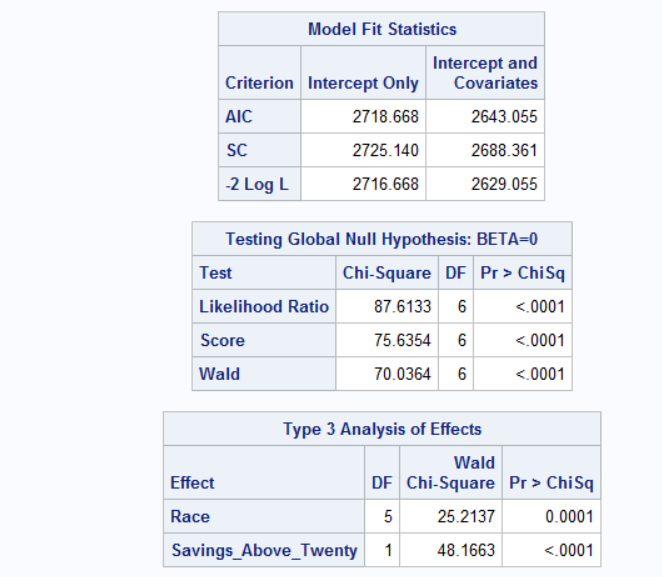
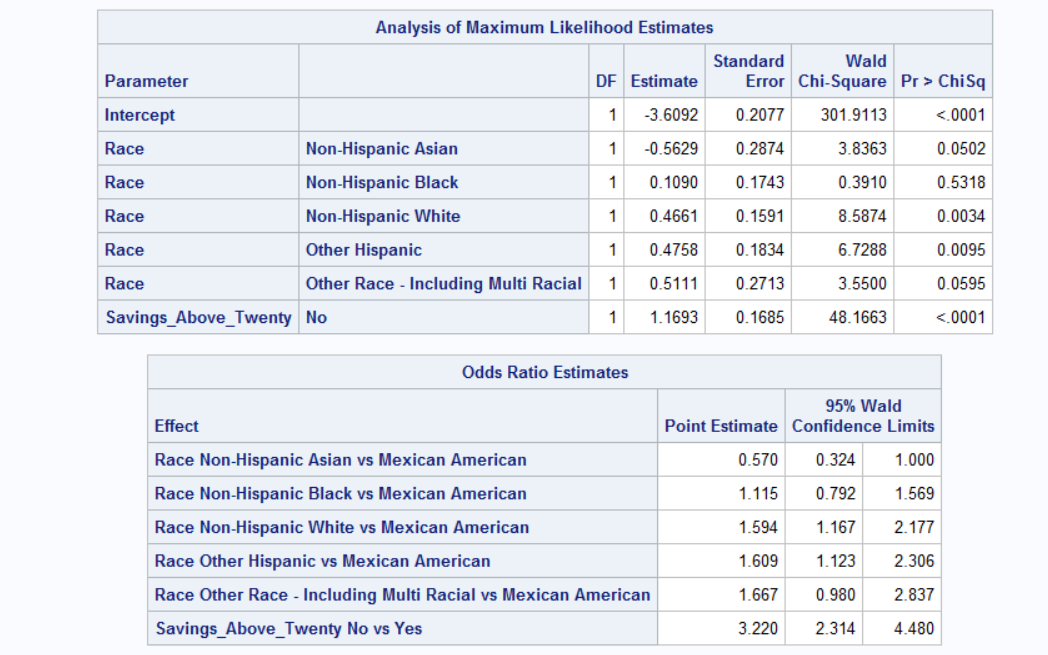
Currently I am interpreting NHANES data through proc logistic in an attempt to identify confounders; relationship of interest is 'rate of depression' from 'total savings.' However, when I employ multi-categorical variables like race and or marital status, I cannot employ the 10% rule as encouraged by my professor to identify confounding. Many of the subcategories are split on whether they are or are not statistically significant at the alpha 0.05 level under the table of Analysis of Maximum Likelihood Estimates. That said, I was encouraged to employ a type III Analysis under proc logistic which identifies if the overall relationship is statistically significant rather than looking at individual p-values (correct me if i'm wrong please). That said, I was wondering if someone could help me understand how 'Race' under the Analysis of Maximum Likelihood Estimates is only partially statistically significant but its p-value under the type III test for the variable of interest is well below the alpha 0.05 level (makes no sense). I will include a picture of the output down below in an image. Thanks

1 Answer
First, there is no way to identify confounders from a multivariable logistic regression. Confounding is a causal concept that requires an understanding of the causal system. The presence or lack of an association in a regression does not inclicate the presence or absence of confounding by the corresponding variable. It should not be used as a criterion to decide whether to adjust for that variable in a future model.
Second, understand that the coefficients for the race categories correspond to the estimated difference in the log odds of the outcome between each category and the reference category (in this case, Mexican American). It may be that these differences are fairly small, but it is possible that differences among the non-reference categories are large. Indeed, we see that the difference between Other Race and Non-Hispanic Asian is quite large: $.5111 - (-.5629) = 1.074$. This difference is twice as large as any of the differences between the reference category and the other race categories. The p-value on Race in the ANOVA reflects that there is a substantial effect of race; it just happens not to be between the reference category and the other race categories.
