I can understand why if from your univariate data (1 column?) you plot a histogram which seems to have 2+ peaks ie a mix of more than 1 gaussian. But what if you plot a histogram and there looks to be 1 peak - can't you just sum the data and divide by n for the mean as usual, and then plot a gaussian using this mean and a calculated variance? Same for multivariate data (more than 1 column?) - if each column individually looks to have 1 peak, can you not calculate the mean and variance of each column and plot gaussians using them? Why must we use EM steps to estimate the mean and variance?
1 Answer
A mixture of Gaussian distributions is not necessarily multi-modal. Therefore, if a priori you have reason to believe that the data comes from a mixture with an unknown number of components, it is not sufficient to observe only one peak in the data to conclude that a mixture only has one component (i.e. that it is actually normal).
For example, say $Y$ follows a mixture distribution where the component distributions are $\mathcal{N}(\mu, \sigma_i^2)$ with $i=1,2$ and $\sigma_1^2\neq \sigma_2^2$, and mixture parameter $0 < \omega < 1$. This distribution will be unimodal because the components share the same location parameter. If $f(y,\mu,\sigma^2)$ is the density for $\mathcal{N}(\mu, \sigma^2)$, then the mixture density is:
$$p_Y(y) = \omega f(y, \mu, \sigma_1^2) + (1-\omega)f(y, \mu,\sigma_2^2)$$
You can compute that the mean is:
$$E(Y) = \omega \mu + (1-\omega) \mu = \mu$$
and the variance is (because the means of the components are identical):
$$\text{Var}(Y) = \omega \sigma_1^2 + (1-\omega) \sigma_2^2$$
However, this is not at all the same distribution as a single normal with the same mean and variance. As an example and to simplify the computations, take $\mu=0$, and we can derive that the kurtosis of $Y$ is then given by:
$$\text{kurt}(Y)=3\frac{\omega\sigma^4_1+(1-\omega)\sigma^4_2}{(\omega\sigma_1^2+(1-\omega)\sigma_2^2)^2}$$
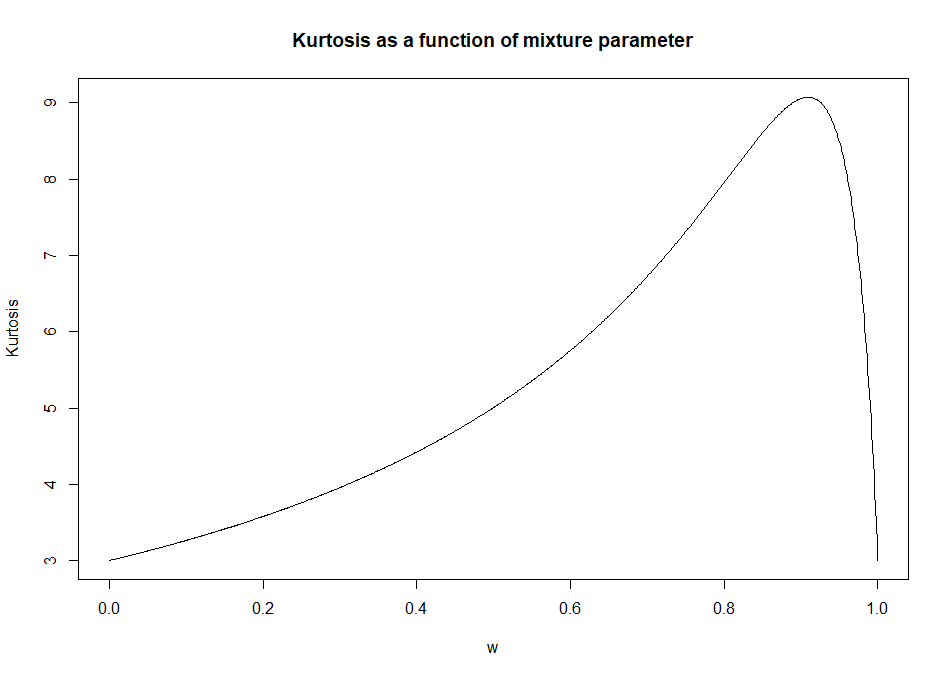
For $\sigma_1^2 = 1$ and $\sigma_2^2=10$, it looks like this as a function of the mixture parameter:
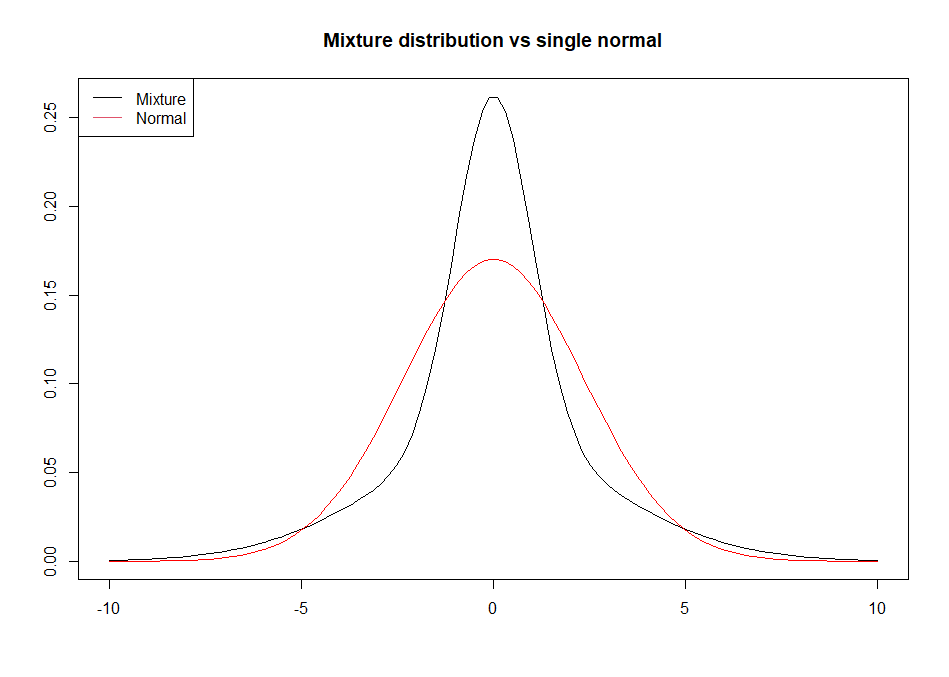
On the other hand, a single normal distribution always has a kurtosis of 3, so it's possible to obtain unimodal normal mixture distributions that behave very differently from a single normal distribution. You can also see graphically that the density of the mixture (here $\omega = 0.5$) looks very different from a single normal distribution with the same mean and variance:


