1
$\begingroup$

I wanted to forecast student fall enrollment using last 3 years of data. Registration open day for fall differs by year. For instance, Fall registration open day in 2019 was March 10 and ended in say August 22, March 20 in 2020 and ended in August 22, so on! Therefore, for 2019 I have total 155 days of data, 156 for 2020, and 165 for 2021. As a result, we have ended up with different length of time series per year. I wanted to forecast the fall enrollment for 2022 at the last day of registration. I am not sure how can address this issue! Most time series I have seen has equal time length per year. I appreciate your suggestions. Thanks!

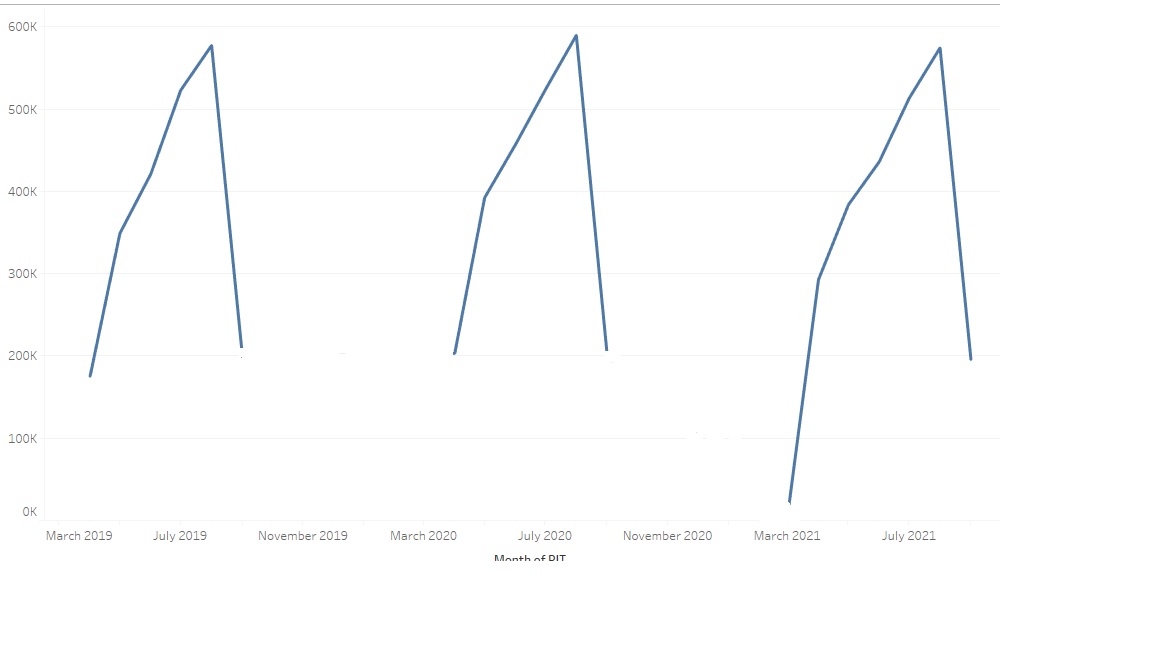
Original data plot:

enter image description here

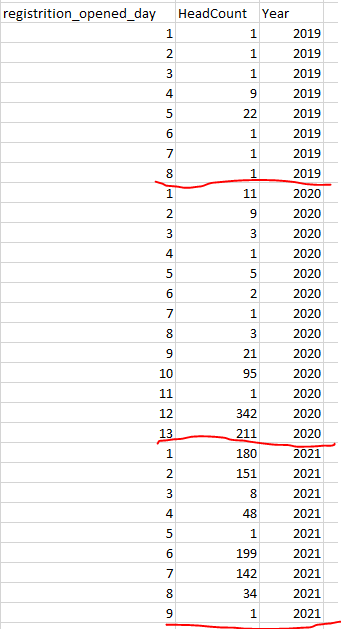
Sample data:

enter image description here

$\endgroup$
3
  • $\begingroup$ If the dates you quote are perfectly predictable in the future, you could model the number of enrolled students per day and sum the numbers to get a complete « cycle ». $\endgroup$ Commented Mar 18, 2022 at 15:26
  • $\begingroup$ @MaximilianAigner How can I do that? For standard time series, we need to have monthly, daily or yearly frequency. How can I set the frequency for this unequal time length? Thanks! $\endgroup$
    – ForestGump
    Commented Mar 21, 2022 at 14:55
  • 1
    $\begingroup$ Many programming languages (certainly LabVIEW and MATLAB) have a "re-sampling" feature, where you can take a dataset and essentially interpolate to a different sampling frequency. Pro: you now have the desired number of samples. Con: your data is not "real" any more, in the sense of being actual measured values. You could just try that. $\endgroup$ Commented Mar 29, 2022 at 19:59

2 Answers 2

0
$\begingroup$

One way is playing with the sampling rate, as mentioned by others. Another is finding a different "common ground" on your time axis (sometimes reffered to as "bucketing").

Check whether all months exists on each year (March to Augost). If so, try grouping by months while using different aggregation functions, along with the last day of each month (the last of March is covered - and that's what you're looking for).

So, instead of:

  • year
  • day
  • head_count

You'll have something like:

  • year
  • month
  • last_day_enrollment

That's the bare minimum, but in order to preserve information / variance-explained, try adding a mix of:

  • enrollment_days_in_month
  • monthly_mean_enrollment
  • monthly_std_enrollment
  • 1st_day_enrollment
  • median_day_enrollment

In case some "rogue" month is missing in some of the years - try finding a larger common ground, for example: same stats as aboth, just for 2-consecutive months (March-April, May-June, July-Augost)

$\endgroup$
0
$\begingroup$

I have made a equal length time series here and fit ARIMA model to forecast the enrollment.

$\endgroup$

Your Answer

By clicking “Post Your Answer”, you agree to our terms of service and acknowledge you have read our privacy policy.

Not the answer you're looking for? Browse other questions tagged or ask your own question.