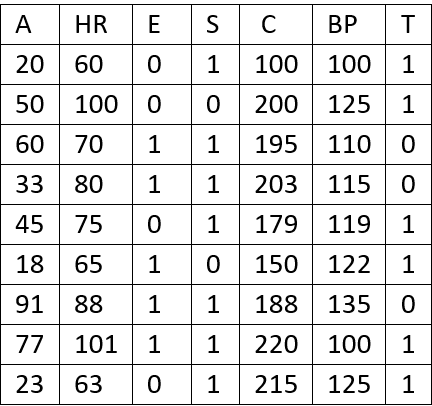
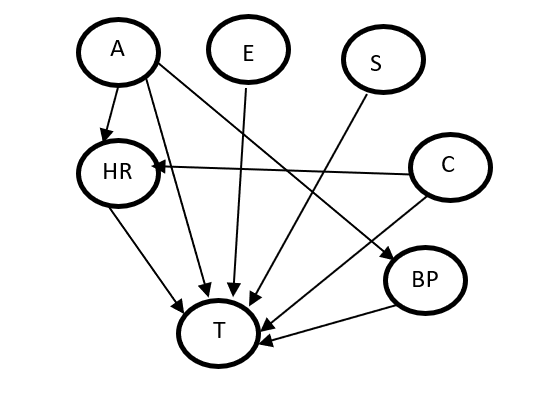
The application of Bayesian Networks to tabular data is called learning in Bayesian networks. There are many sources for that.
The topic is interesting and maybe complex, but in general one defines parameters (unknown probabilities in the conditional probability tables and unknown parameters of distributions - for example mean and variance of a gaussian) and add them to the BN. Thus the conditional probability table that uses that unknown probability will also depend on that parameter, as will the gaussian with unknown mean. This parameters are top nodes in the BN (no parents), and thus one has to specify their priors. If the parameter is a unknown probability, the prior is usually a beta distribution; if the parameter is a set of related probabilities, the prior is a Dirichlet distribution, and so on.
The data in the table contains values of some of the variables in the BN. Learning in this case is computing
$P(\mathbf{\theta}| Data, BN)$
where $Data$ is the dataset, $BN$ is the bayesian network, and $\theta$ is the set of parameters. This is a standard inference in a BN!! If $\theta$ has a prior distribution, $P(\mathbf{\theta}| Data, BN)$ will compute a posterior distribution. But this is a distribution of values for each parameter. If for some reason you want a single number, then you may select the Maximum a-posteriori value for the parameters, that is the value that maximizes $P(\mathbf{\theta}| Data, BN)$
$MAP = argmax_{\theta} P(\mathbf{\theta}| Data, BN)$
Another alternative to compute a single number/set of numbers is not to consider the unknown probabilities as random variables in the BN, but as "simple" variables (unknown values) in the conditional probability tables. Then, a possible single number for these unknown probabilities are the values that maximize the probability of the data. This is called the Maximum Likelyhood estimation
$MLE = argmax_{\theta} P(Data | \mathbf{\theta}, BN)$
There are relations between MLE and MAP (see for example https://dsp.stackexchange.com/questions/64865/understanding-the-difference-between-map-estimation-and-ml-estimation)
If you are looking for the MLE or MAP there are simplified equations for some conditions regarding the priors of the parameters, and there is no need to compute the full BN inference of $P(\mathbf{\theta}| Data, BN)$.
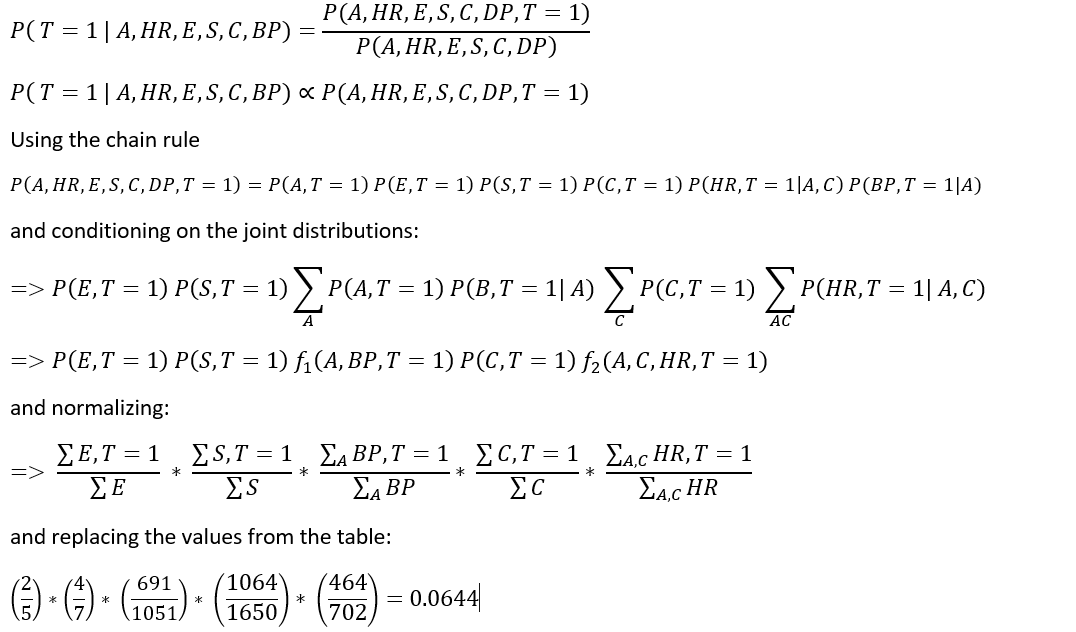
In particular the calculations of the ratio of counting how many examples are in the dataset that you alluded in the question is the simplified equations for the MLE/MAP for random variables are that multinomial (multiple values) where the parameters are the entries in the conditional probability table, and where the priors for these parameters (unknown related probabilities) is a Dirichelet distribution.
But notice that in your data, variables such as A, C, BP, HP seems to be continuous, and thus they are not multinomial, and the counting formulas will not apply.
To summarize, the OP should check some of the literature on learning in BN.


