2
$\begingroup$

The Context

My dataset consists of 68 groups, each with 4 data points inside it.

As means of a robustness test, I am looking to see how the type of average/mean I use impacts the analysis that I will make.

In this case, I am using five types of means which are (1) a harmonized mean, (2) a geometric mean, (3) an arithmetic mean, (4) a trimmed arithmetic mean, and (5) a winsorized arithmetic mean.

The Question

After reading, I understand that the common practice for winsorizing is by first selecting a value of x% - of which the top x% percentile and bottom x% percentile that will be then winsorized. However, I was wondering if the following approach would be better suited to my case:

Doing a Grubbs' / Dixon's test to identify outliers in each group, and then winsorizing those outliers. Would this be better than selecting a certain x%? This is because I only have four data points.

Side Note (Open to any comments)

I understand that Grubbs and Dixon both operate under the assumption of normally distributed data, so I have also conducted a normality test (Shapiro-Wilk) for all 68 groups. However, I have also read a study (https://www.osti.gov/biblio/5478051-note-robustness-dixon-ratio-test-small-samples-testing-outliers) that mentioned Dixon's Q-test can operate on non-normal distributed data given a small samples (3-5). Hence, a. For groups that are normally distributed, I apply the Grubbs test to find for outliers. b. For groups that are non-normally distributed, I apply the Q-test to find for outliers.

$\endgroup$
2
  • $\begingroup$ The median of four observations is the mean of the middle two. This is about as robust against outliers as it gets. Trimming will result in the same thing (if anything is trimmed), and there isn't enough information in the data to do meaningful Winsorisation, I'd say. For better efficiency you may consider estimators such as Huber's M-estimator. Here's a version that works better in really small samples: sciencedirect.com/science/article/abs/pii/S0167947310001878 R-package smoothmest $\endgroup$ Commented Jun 21, 2022 at 16:00
  • $\begingroup$ Any testing won't have good power with $n=4$. $\endgroup$ Commented Jun 21, 2022 at 16:01

1 Answer 1

3
$\begingroup$

If you have 3-5 points per group then running normality tests, detecting outliers, removing, or winsorizing them makes very little sense. The samples would be too small to say something meaningful about the distribution. For example, if you run the Shapiro-Wilk test for normality with a sample of size 5, you would get $p$-value that is about 0.4 for data coming from a uniform distribution and 0.5 for data coming from the normal distribution. You could toss a coin as well.

> summary(replicate(10000, shapiro.test(runif(5))$p.value))
     Min.   1st Qu.    Median      Mean   3rd Qu.      Max. 
0.0001726 0.1945197 0.4204441 0.4455712 0.6767757 0.9999371 
> summary(replicate(10000, shapiro.test(rnorm(5))$p.value))
     Min.   1st Qu.    Median      Mean   3rd Qu.      Max. 
0.0005503 0.2547436 0.4944521 0.5012863 0.7502373 0.9999868 

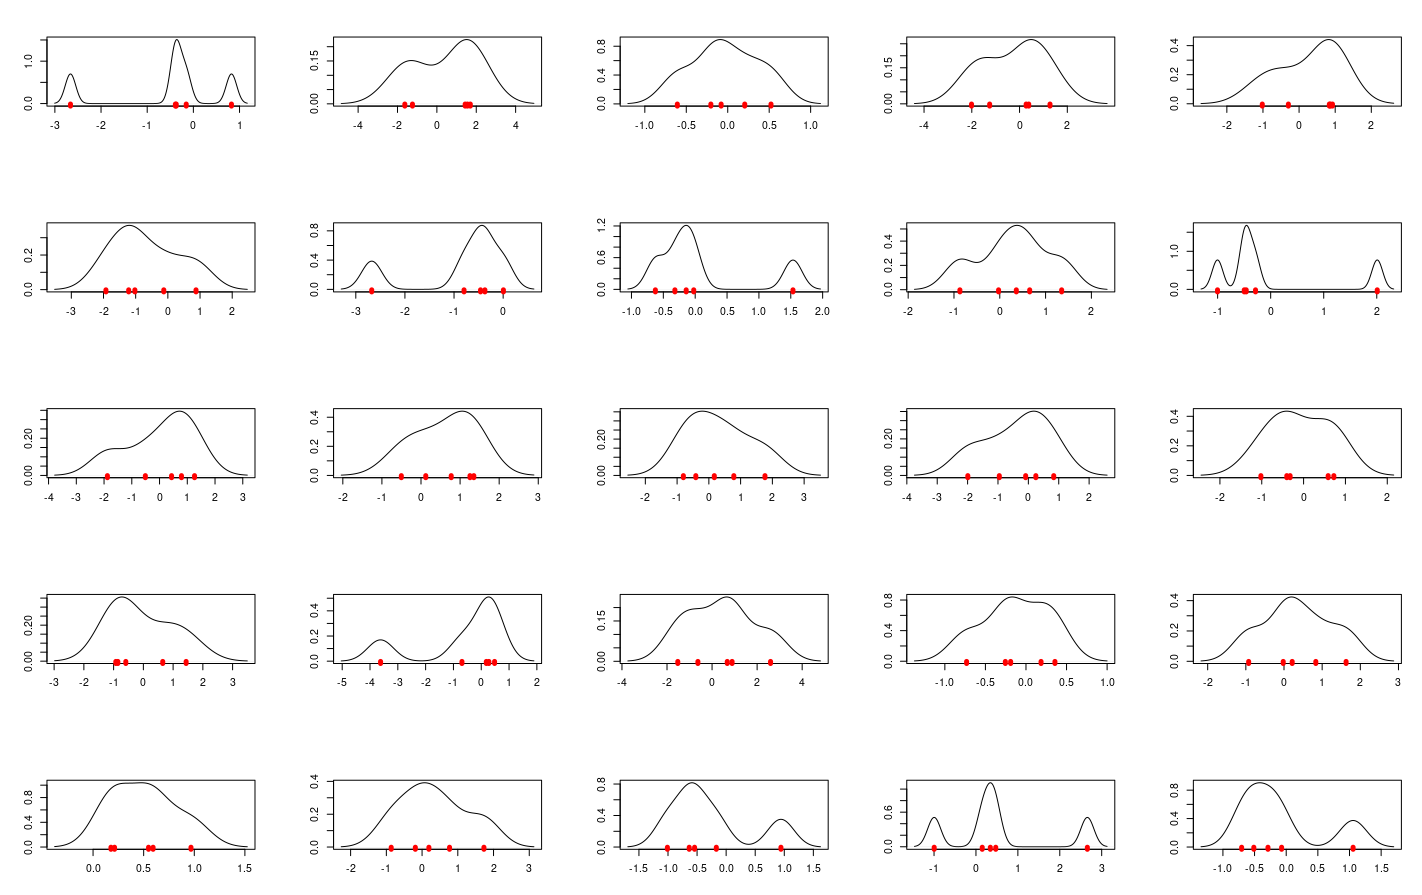
Same with detecting outliers: below you can see 25 random draws from a standard normal distribution, how many "outliers" do you see on the plots? At least six plots look like having "outliers", but in fact, we just have tiny sample sizes, so tiny differences look large, while with larger sample sizes you would be able to better judge the actual distributions of the data.

enter image description here

Also notice that considering such values as outliers makes little sense conceptually. If you have five values, considering one of the points an outlier means that you consider 20% of the data to be outliers, if you mark two values as outliers, 40% of the data is considered as outliers. Outlier is a value that differs from the majority of other observations, while here the "outliers" would nearly be the majority.

If you have 3-5 points throwing away even a single point (directly, or by replacing it with another value) is a huge loss of the data. Moreover, if you substitute the value with something, it would in many cases strongly bias your results. Even with larger data, discarding "ugly" data is usually a bad idea that leads to cherry-picking. Statistics is not about throwing away data that is inconsistent with your hypothesis, it's the other way around.

I recommend you to check other questions tagged as for many examples of dealing with small samples. This is a hard and tricky problem and the procedure you choose for the data will have a significant influence on the results you will obtain, so you need to proceed with caution.

$\endgroup$
6
  • $\begingroup$ Classical robustness theory is concerned with breakdown under up to 50% of outliers (50% cannot be handled but slightly less can). For sure it is reasonable to worry about a sample of four being led astray by one outlier, and if the fourth observation is very far from the other three which are closely together, it is sensible to do something about this. The median or Huber's M-estimator improve on the mean regarding robustness, and there isn't anything wrong with using them for that reason. Also @Son18 $\endgroup$ Commented Jun 21, 2022 at 15:55
  • $\begingroup$ @ChristianHennig agree. $\endgroup$
    – Tim
    Commented Jun 21, 2022 at 17:59
  • $\begingroup$ @ChristianHennig + @ Tim Thank you so much for the responses. I now better understand the shortcomings of the tests I am conducting in relation to the situation I am facing. For context, the 68 groups are 17 financial metrics in the past 4 financial years (different year = different group), while the four data points refer to 4 companies. Not much room. That being said, I will try to use the median and Huber's M-estimator. The follow-up question: Does this conclude that the outlier detection via Grubb and Dixon is basically powerless and should be omitted from my research entirely? $\endgroup$
    – Son18
    Commented Jun 22, 2022 at 10:33
  • $\begingroup$ @Son18 The problem with this in my view is not so much the power of these tests, but rather what to do with the outliers once they are detected. Note that "outlier" is an ambiguous term and for sure doesn't necessarily mean that these observations are "wrong" and need to be removed or replaced. For this reason I generally prefer estimators that accommodate outliers and make them less influential to procedures that remove or replace them. $\endgroup$ Commented Jun 22, 2022 at 15:37
  • $\begingroup$ @Son18 Note that both of these tests will identify outliers as observations that are not in line with normality, but this of course doesn't mean there's anything wrong about them. The Technical report you have linked doesn't seem clear to me regarding the fact that if you try this out on other distributions, even the very definition of an outlier may have to be changed. $\endgroup$ Commented Jun 22, 2022 at 15:44

Your Answer

By clicking “Post Your Answer”, you agree to our terms of service and acknowledge you have read our privacy policy.

Not the answer you're looking for? Browse other questions tagged or ask your own question.