2
$\begingroup$

TL;DR: How to evaluate effect of variable on (bimodal) outcome?

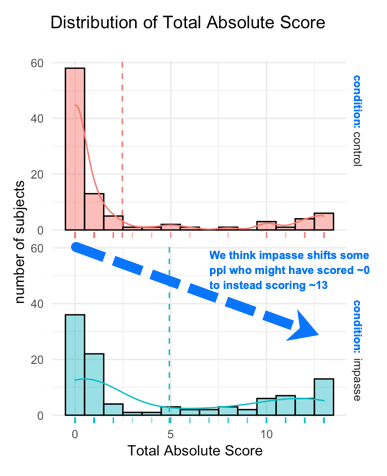
Context Please see below a faceted histogram of the outcome variable (Total Absolute Score) of a recent experimental (psych) study. The outcome variable (Total Absolute Score) indicates the number of correctly answered questions on a graph-reading task (ranges from 0 to 13; score on a sequence of 13 questions). The faceting variable (condition) refers to the 2 experimental conditions in the study (control vs. impasse)

enter image description here

Data Generating Process The task that generates the Total Absolute Score measures understanding of a novel graph. In past studies we've found that most readers either can complete the task accurately from the beginning of the task onwards (i.e. the high scores at the far right of the graph) or (more often) cannot do it at all(the low scores at the left of the graph). Very few subjects figure out how to correctly answer the questions halfway through the task (scores in the middle; indicating some Qs answered incorrectly and some correctly [in that order]). The experimental condition (impasse) is designed to improve performance by shifting people from 'not understanding' to 'understanding'.

The Problem: Given the very-not-normally-distributed nature of this distribution, what is an appropriate analysis strategy to quantify any effect of condition on score?

My intuition regarding the actual data generating process at play is that Condition does have an effect on Score, by making some subjects more likely to understand the graph from the beginning of the task (and thus yield a score ~13). Importantly, this understanding does not yield intermediary scores; a person generally 'gets it' on the first few questions, or doesn't get it at all. Essentially, we think that condition works by 'shifting some of the mass' from the low-end of the distribution to the high end. Is there a way to model and quantify this?

A simple linear regression predicting Total Absolute Score from Condition explains ~ 7% variance in score, (with a significant p-value for Condition). But of course the residuals for this model are not normally distributed, and it's an awful fit. The predictions that are made (i.e. dashed lines representing mean of each group) are closer to the least frequent values in each histogram than they are to the modal values.

Other things I've read a little about: (1) Hurdle model? Separately model binary probability of getting 0 score or greater than 0 score AND then probability of the count # of correct Qs. This seems like an intuitive fit for the hypothesized DGP, BUT I'm not certain if its appropriate to treat # of questions correct on an exam as a count variable? (2) Modelling at the question rather than subject level? So the outcome is 0 or 1, but would also need to account for sequence of items (logistic mixed effects model? predicting accuracy [correct/incorrect] by condition + subject + question?

Any advice & pointers to readings / tutorials are much appreciated! I have a 3 studies with this task that show the same pattern of the results.

UPDATE (To answer Qs that have been asked) : The data are from a between-subjects (crossed) study, so the groups are independent, not paired. I do have scores (0,1) at the item level, but this distribution is for the total score (sum across all items for each subject).

$\endgroup$
6
  • $\begingroup$ You seem to have three groups (1- High performers 2- Under performers 3- moderate performers) and thus a mixture of three distributions associated with them. So you need to use a mixture model and measure how the weight associated with each distribution changes from control to treatment. I believe there are many resources on Mixture modelling if you search. There is also a course on Coursera called: "Bayesian Statistics: Mixture Models" that might help. $\endgroup$
    – Amin Shn
    Commented Jul 11, 2022 at 9:38
  • $\begingroup$ A simplification could be made by categorising the individuals into two groups if you wish to stick with the bimodal assumption as opposed to three. And then you can simply test the hypothesis of how the proportion of the two groups changes because of the treatment which would be a much simpler approach. $\endgroup$
    – Amin Shn
    Commented Jul 11, 2022 at 9:42
  • 1
    $\begingroup$ Is this a paired measurements (before/after) study or do you assess two separate samples of students? If the former, consider analyzing test differences. $\endgroup$
    – whuber
    Commented Jul 11, 2022 at 14:35
  • $\begingroup$ Thanks for the thoughtful responses! Regarding mixture modeling… I looked into this a little bit and will do so again. I wasn’t sure how to proceed because I didn’t seem that it would be appropriate to use a mixture of Gaussians. Is it possible to do a mixture of other distributions, and if so what would you recommend? Also couldn’t find any resources that helped explain how you could apply mixture modeling in the context of hypothesis testing for a study… The resources I found were using it for clustering or classification purposes. Any pointers? $\endgroup$
    – madebyafox
    Commented Jul 11, 2022 at 15:05
  • 1
    $\begingroup$ Do you have data Q by Q? Is the data paired? Sample sizes? ... Please add new information as an edit to the post, not only as comments, as comments can be (are!) overlooked and can be deleted! $\endgroup$ Commented Jul 13, 2022 at 1:17

2 Answers 2

0
$\begingroup$

You state that you want to quantify the effect of intervention on score -- but you don't mention what for. Depending on the use case, it might be appropriate to measure the fraction that score at or below three, showing that more people get the material. Or as multiple groups. I'd be tempted to look at how the mean improved as well, and the median, not least, all depending on use case. Maybe even the mean of the top 80 %?

If you want to be really fancy, you could fit a mixture of two distributions onto the results and compare how the lower and upper modes differ. If that would help you in your decision.

That is, any summary measure must be picked to help drive a specific decision. Then you pick a measure that is clinically meaningful for that decision.

If you're just reporting on the outcome of the study so that others can drive decisions from your data, then the appropriate level of summation is "as little as possible". Report your histograms in a table! Let others pick the correct summary measures depending on the decisions they will drive.

Complement that with whatever summary you feel is most appropriate, but be aware that you're not able to pick the right one for all decisions.

$\endgroup$
0
$\begingroup$

First, OLS regression does not assume that the dependent variable is normally distributed. It makes assumptions about the errors; we usually look at that through analysis of the residuals. However, it is likely that the errors are not close to normal.

Second, a useful method here might be quantile regression. Rather than estimate the mean (as OLS regression does), quantile regression estimates quantiles. This would have two advantages here. A) Quantile reg makes no assumptions about the distribution of the errors and B) It lets you estimate whichever quantiles you like. This could be very different for the low scorers and the high scorers.

I did an analysis of the birth weights of babies and found that predicting the 10th percentile gave very different parameter estimates than estimating the median. This was important because doctors want to know, in advance, if a baby is likely to be low birth weight.

$\endgroup$
1
  • $\begingroup$ Laplace distribution MLE in quantile regression could be seen as analogous to Gaussian distribution MLE in OLS. I’m not sure that I buy a claim that quantile regression does not assume a particular conditional distribution yet OLS does. $\endgroup$
    – Dave
    Commented Dec 15, 2023 at 16:14

Your Answer

By clicking “Post Your Answer”, you agree to our terms of service and acknowledge you have read our privacy policy.

Not the answer you're looking for? Browse other questions tagged or ask your own question.