2
$\begingroup$

I am working on a lithology identification project similar to the one described here. The idea is to train a model using well log data collected at a handful of drillholes, in order to predict the "rock type" in other drillholes.

I am comparing the performance of 3 different algorithms:

  1. AdaBoost
  2. SVM
  3. RandomForest

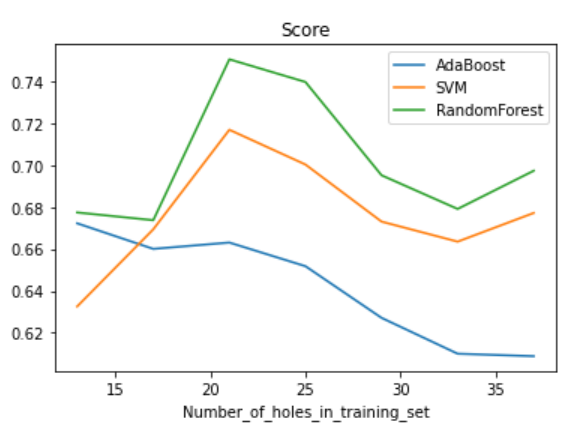
I am calling sklearn's cross_val_score to assess the performance of each model. I did plot the mean score (cross_val_score(clf, X, y, cv=5).mean(), where X is the training data) for each method as a function of the number of holes used in my training set, i.e. the size of my training set.

Interestingly, the score does not increase as the size of the training set increases.

enter image description here

According to this stats stack exchange post:

one situation where more data does not help---and may even hurt---is if your additional training data is noisy or doesn't match whatever you are trying to predict.

Is this what is happening?

--- EDIT: answering the questions raised by @cbeleites unhappy with SX ---

My total dataset contains ~1,500 drill holes. For each hole, I have well log data from 4 different logs (let's call them measurement_A to measurement_D). Based on my knowledge of these well log data, I would say that they are not repeated measurements of the same feature, thus corresponding to what @cbeleites unhappy with SX calls situation (b) . These data are acquired using different sensors, have different units, etc... They essentially measure different mechanical properties, although in practice they often end up being correlated.

Out of these ~1,500 holes, I select 35 holes as my training set. The remainder of the data, I use as my test set.

In practice, my training_data consists of a Pandas dataframe containing the features on which to train the model, and the labels to predict.

Here is a simplified version of my train_model function

def train_model(training_data, features, labels):
    X=training_data[features]  # Features
    y=training_data[labels]  # Labels
    clf = make_pipeline(preprocessing.StandardScaler(), RandomForestClassifier(n_estimators=100, min_samples_split = 5, min_samples_leaf = 4, max_depth = 10, bootstrap = True))
    print(cross_val_score(clf, X, y, cv=5))
    classifier = clf.fit(X,y)
    return clf 

I call this function as follows:

clf = train_model(training_data, features_to_train_model, labels)

Where features_to_train_model = [measurement_A, measurement_B, measurement_C, measurement_D].

So in a nutshell, my X matrix contains 4 columns (one column per measurement) and 35,000 rows (one row per 1 cm depth increment, for all 35 drillholes), while my Y array contains 35,000 rows (again, one lithology label per depth).

I am aware that when I call cross_val_score(clf, X, y, cv=5), it does a test/train split on my training data only. I was naïvely expecting the scores to improve with an increasing dataset size, but that was neglecting the "error" referred to by @Sycorax.

$\endgroup$
0

2 Answers 2

5
$\begingroup$

I don't think this result is too surprising. Each of the points in your plot has an associated error measurement associated with it. The overall number of holes only varies in a small range, so the error will be similar at both extremes of number of holes. The largest number of holes you have is still quite small, so the results seem to be primarily driven by the scarcity of data. To apply a high-complexity model like boosting or random forest, you'll need much more data.

$\endgroup$
13
  • $\begingroup$ Thanks for your quick answer, @Sycorax. FYI, the number of holes is fairly small, but the features used for training actually consist of 4 densely sampled well logs for each hole. That being said, I understand that my training set may not be large enough for Random Forest or AdaBoost. $\endgroup$
    – Sheldon
    Commented Jul 25, 2022 at 16:25
  • $\begingroup$ $4 \times 35 = 140$, so that's still a very small sample size for random forest, boosting and SVM. $\endgroup$
    – Sycorax
    Commented Jul 25, 2022 at 16:27
  • $\begingroup$ It is actually 35 drillholes x 4 well logs x 1000 well log samples = 140,000 samples, considering 10m holes sampled every centimeter. $\endgroup$
    – Sheldon
    Commented Jul 25, 2022 at 16:30
  • 1
    $\begingroup$ What's the difference between drill holes, well logs and "points"? In any event, I suspect that the clustered nature of your data imply strong correlation among the datapoints, so the effective number of observations is much smaller than 140,000 (cf spatial autocorrelation). $\endgroup$
    – Sycorax
    Commented Jul 25, 2022 at 16:34
  • 2
    $\begingroup$ The number of features doesn't increase the sample size, so the 140,000 calculation is simply incorrect. // More broadly, theres a long history in statistics of using data about nearby holes to make inferences about geological properties of hypothetical holes in between the drill sites, so my recommendation would be to start there. Kriging, Gaussian processes and spatial auto-correlation are some terms of art to use getting started. $\endgroup$
    – Sycorax
    Commented Jul 25, 2022 at 16:42
2
$\begingroup$

To add to @sycorax' answer:

If I understand the description of your data correctly, you have

  • features: resistivity, density, ...
    (how many such physical properties do you have?)

And in terms of samples a more complicated structure with:

  • 35 drill holes,
  • 4 well logs per drill hole these are either
    • (a) repeated measurements of the same feature
      • in which case we'd say that well log is nested within drill hole and
      • expect high correlation; or
    • (b) they give you one or more features each,
      • in which case we'd merge the well logs along their depth to form more columns of the data matrix
      • I'm chemometrician, we'd refer to this as multiblock structure
  • about 1000 points/readings along each well log
    • the points are recordings of your features at different depths.
    • in situation (a), points are nested within well log and [automatically] also within drill hole
    • in situation (b), points are nested within drill hole
    • I'd expect points to be highly correlated.

Unfortunately, the classifiers you use do not take into account such data structures. However, they can often still work well.
The point where the nesting becomes really important is validation (verification), such as cross validation. The "small print" of the verification procedures says that the (surrogate) models are evaluated with independent cases, but your data structure means that you have dependencies (correlation) between some of your points. You thus need to account for the nested data when setting up the cross validation splits, i.e., you need to split by drill hole, so that any drill hole that appears in a given test set does not contribute any training points to the respective surrogate model.

Also, when looking at the uncertainty of your measured model performance, you need to account for these correlations. As a conservative bound, we can say that your sample size is possibly as low as the number of drill holes. That allows for a back-of-the-envelope calculation of uncertainty due to the limited number of drill holes in your observed scores. AFAIK, the scores you compute are overall accuracy, i.e. the fraction of correct predictions among all test predictions. For such fraction, we can calculate binomial confidence intervals. E.g., the 95 % c.i. for an observed fraction of 0.66 with n = 15 drill holes tested ranges from 0.4 to 0.8(5), 0.6 with n = 35 drill holes tested 0.4(4) - 0.7(4).
Thus, they are all wider than the variation you observed. Of course, the effective sample size may be larger in your case. OTOH, this uncertainty due to limited sample size does not include additional sources of random uncertainty such as model instability.

*unless you can show that there is no important corelation, but that anyways requires doing the analysis as described above first :-)

$\endgroup$
1
  • $\begingroup$ Thanks a lot for your detailed answer. I edited my question to provide you with additional information. $\endgroup$
    – Sheldon
    Commented Jul 28, 2022 at 0:42

Your Answer

By clicking “Post Your Answer”, you agree to our terms of service and acknowledge you have read our privacy policy.

Not the answer you're looking for? Browse other questions tagged or ask your own question.