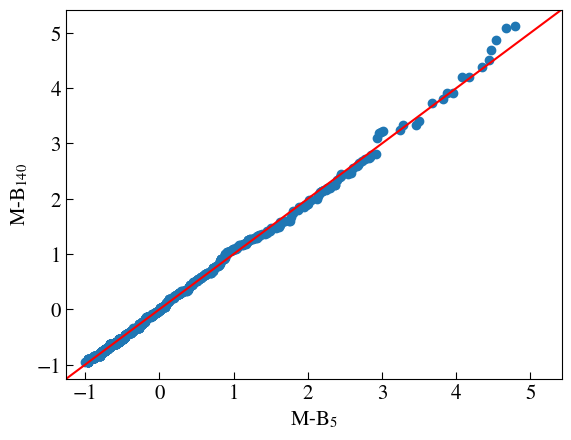
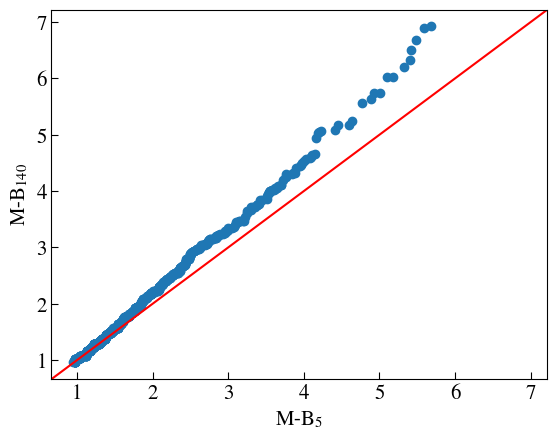
I am trying to make two-sample Q-Q plots in Python.
A Python function that is used for calculating quantiles has the option of fitting parameters for the calculation of quantiles. These parameters are mentioned to be location and scale. The description of the fitting procedure: "If fit is True then the parameters for dist are fit automatically using dist.fit. The quantiles are formed from the standardized data, after subtracting the fitted loc and dividing by the fitted scale."
My question is then: When should parameters for calculating quantiles be fitted when comparing two distributions? Here is an example of what one of my Q-Q plots looks like fitted vs not fitted:
Thank you for your time!
Source for the Python function for calculating quantiles: https://www.statsmodels.org/dev/generated/statsmodels.graphics.gofplots.ProbPlot.html


