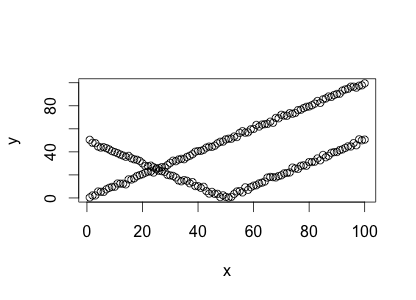
I'm looking for breakpoints in species abundance as a function of spatial distance, using the segmented package for R. 'segmented' appears to return a breakpoint no matter what; I don't understand whether it returns an estimate of the signifcance of the breakpoint (or whether the segmented linear model is better than an unsegmented model).
For instance (R code):
require(segmented)
set.seed(1)
x <- 1:100
y <- rnorm(100) + x # No real breakpoint
y2 <- c(50-x[1:50], x[51:100-50]) + rnorm(100) # Clear breakpoint at 50
plot(x,y)
points(x, y2)

# Segmented model for the unsegmented data
testM <- lm(y ~ x)
testMs <- segmented(testM, seg.Z = ~x, psi=90)
summary(testMs)
Despite the fact that there is clearly no breakpoint in the data, summary reports that t value for the gap-variable(s) V: 0, and the standard error is fairly small (3.28).
testM2 <- lm(y2 ~ x)
testM2s <- segmented(testM2, seg.Z=~x, psi=50)
summary(testM2s)
Here the guess is correct (49.78), the standard error is even smaller (0.2), and the t value is the same. How do I interpret this result?
Note: I have no particular attachment to the segmented package - I just want to test the hypothesis that a segmented regression models my data better than a single-domain regression. But the other breakpoint-analysis packages I've looked at seem to require that points on the domain be evenly-spaced (e.g. timeseries) and there is a single dependent value per independent value. These assumptions are not met for my spatial data.
