3
$\begingroup$

EDIT: Is seems like the dev version of fabletools (.3.2.9000) includes the capability to do what I want via the boostrap option. I'm leaving this question unanswered until things get formally released.

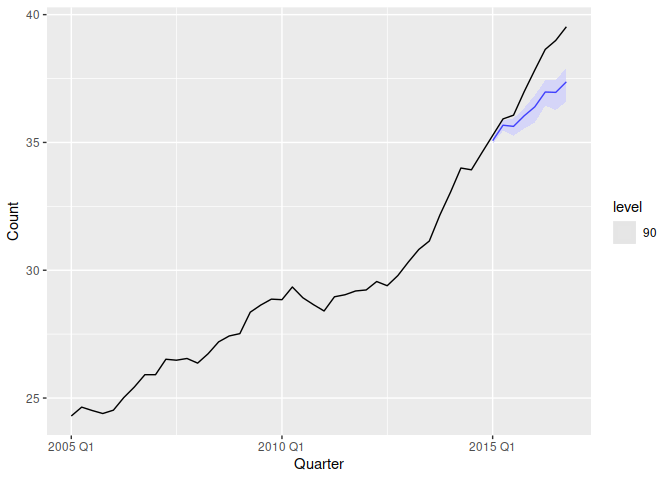
I have a series of grouped forecasts that I'd like to reconcile (ideally via MinT, as below) in a way the preserves the ability to generate prediction intervals. This link seems to imply such a thing is possible (both theoretically and via the fable package) via the bootstrap option, but the default interface does not seem to work-- which is to say the forecasted values are point estimates only. The example this post partially borrows from has prediction intervals, albeit no log transform and no bootstrapping.

Is there a way to generate forecasted prediction intervals for a reconciled set of log-transformed outcome variable using fable? Is such a thing even theoretically possible/sensible?

library('fable', quietly = TRUE)
library('tsibble', quietly = TRUE)
library('lubridate', quietly = TRUE)
library('dplyr', quietly = TRUE)

prison <- readr::read_csv("https://OTexts.com/fpp3/extrafiles/prison_population.csv") %>%
  mutate(Quarter = yearquarter(Date)) %>%
  select(-Date)  %>%
  as_tsibble(key = c(Gender, Legal, State, Indigenous),
             index = Quarter) %>%
  relocate(Quarter)
#> Rows: 3072 Columns: 6
#> ── Column specification ────────────────────────────────────────────────────────
#> Delimiter: ","
#> chr  (4): State, Gender, Legal, Indigenous
#> dbl  (1): Count
#> date (1): Date
#> 
#> ℹ Use `spec()` to retrieve the full column specification for this data.
#> ℹ Specify the column types or set `show_col_types = FALSE` to quiet this message.

prison_gts <- prison %>%
  aggregate_key(Gender * Legal * State, Count = sum(Count)/1e3)


fit <- prison_gts %>%
  filter(year(Quarter) <= 2014) %>%
  model(base = ARIMA(log(Count))) %>%
  reconcile(
    bottom_up = bottom_up(base),
    MinT = min_trace(base, method = "mint_shrink")
  )
fc <- fit %>% select(Gender, Legal, State, MinT) %>% forecast(h = 8, bootstrap = TRUE, times = 10)

fc %>%
  filter(is_aggregated(State), is_aggregated(Gender),
         is_aggregated(Legal), .model == 'MinT') %>%
  autoplot(prison_gts, alpha = 0.7, level = 90)

Created on 2022-09-12 by the reprex package (v2.0.1)

$\endgroup$

1 Answer 1

2
$\begingroup$

The latest development version of fabletools allows you to probabilistically reconcile any forecast if you use sample/bootstrapped forecasts. Try updating the {fabletools} and {distributional} packages to use these new features. More discussion/information about these changes can be found here: https://github.com/tidyverts/fabletools/issues/365

library('fable', quietly = TRUE)
library('tsibble', quietly = TRUE)
#> 
#> Attaching package: 'tsibble'
#> The following objects are masked from 'package:base':
#> 
#>     intersect, setdiff, union
library('lubridate', quietly = TRUE)
#> 
#> Attaching package: 'lubridate'
#> The following object is masked from 'package:tsibble':
#> 
#>     interval
#> The following objects are masked from 'package:base':
#> 
#>     date, intersect, setdiff, union
library('dplyr', quietly = TRUE)
#> 
#> Attaching package: 'dplyr'
#> The following objects are masked from 'package:stats':
#> 
#>     filter, lag
#> The following objects are masked from 'package:base':
#> 
#>     intersect, setdiff, setequal, union

prison <- readr::read_csv("https://OTexts.com/fpp3/extrafiles/prison_population.csv") %>%
  mutate(Quarter = yearquarter(Date)) %>%
  select(-Date)  %>%
  as_tsibble(key = c(Gender, Legal, State, Indigenous),
             index = Quarter) %>%
  relocate(Quarter)
#> Rows: 3072 Columns: 6
#> ── Column specification ────────────────────────────────────────────────────────
#> Delimiter: ","
#> chr  (4): State, Gender, Legal, Indigenous
#> dbl  (1): Count
#> date (1): Date
#> 
#> ℹ Use `spec()` to retrieve the full column specification for this data.
#> ℹ Specify the column types or set `show_col_types = FALSE` to quiet this message.

prison_gts <- prison %>%
  aggregate_key(Gender * Legal * State, Count = sum(Count)/1e3)


fit <- prison_gts %>%
  filter(year(Quarter) <= 2014) %>%
  model(base = ARIMA(log(Count))) %>%
  reconcile(
    bottom_up = bottom_up(base),
    MinT = min_trace(base, method = "mint_shrink")
  )
fc <- fit %>% select(Gender, Legal, State, MinT) %>% forecast(h = 8, bootstrap = TRUE, times = 10)

fc %>%
  filter(is_aggregated(State), is_aggregated(Gender),
         is_aggregated(Legal), .model == 'MinT') %>%
  autoplot(prison_gts, alpha = 0.7, level = 90)

Created on 2022-09-20 by the reprex package (v2.0.1)

$\endgroup$

Your Answer

By clicking “Post Your Answer”, you agree to our terms of service and acknowledge you have read our privacy policy.

Not the answer you're looking for? Browse other questions tagged or ask your own question.