2
$\begingroup$

I am reading Generalized linear models with random effects : unified analysis via h-likelihood Chapter 4 on Extended Likelihood principle. I came across an example and I am not sure if I am understanding joint maximization correctly. Given extended likelihood where $\theta$ is a single fixed parameter, U is a single unobservable random quantity and a single observable quantity Y. \begin{equation} L(\theta, u; y, u) = \theta u \exp(-u(\theta+y)) \end{equation} The support is u>0, $\theta>0$.

When jointly maximized wrt to $\theta$ and $u$, the book says it yields $\hat{\theta} = \infty$ and $\hat{u} = 0$.

My derivations are \begin{equation} \begin{split} \frac{d l(\theta, u; y, u)}{d\theta} = 1/\theta - u \\ \frac{d l(\theta, u; y, u)}{du} = 1/u - \theta-y \\\end{split} \end{equation} I get $\hat{\theta}$ = 1/u and $\hat{u}$ = $\frac{1}{\theta + y}$ I don't understand how the jointly maximized values are $\infty$ and 0 respectively. Do we integrate out the value eg. $\int_0^\infty(1/u) du$ here to get that? Thank you!

$\endgroup$

1 Answer 1

3
$\begingroup$

A contour plot at some fixed value of $y$ should be helpful to be convincing. (And these plots are certainly not equivalent to a proper mathematical approach.)

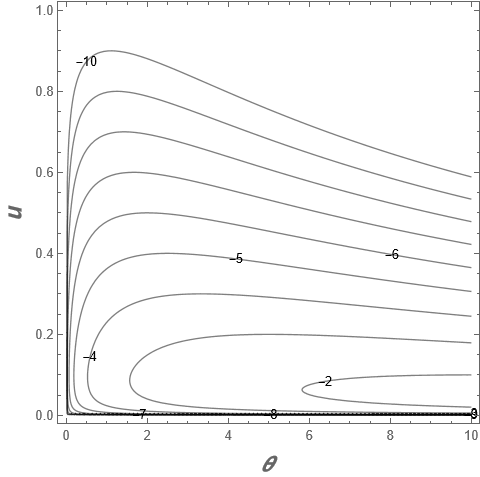
Using Mathematica (and R could certainly be used), here is a contour plot of the log of $L$ for two different sets of $\theta$ and $u$ with $y=10$:

logL = Log[θ] + Log[u] - u (θ + y)
ContourPlot[logL /. y -> 10, {θ, 0, 10}, {u, 0, 1}, 
Contours -> Range[-10, -1, 1], ContourShading -> False, 
ContourLabels -> True, PlotPoints -> 50,
FrameLabel -> (Style[#, Bold, 18, Italic] &) /@ {"θ", "u"}]

Contour plot with two ranges of theta and u

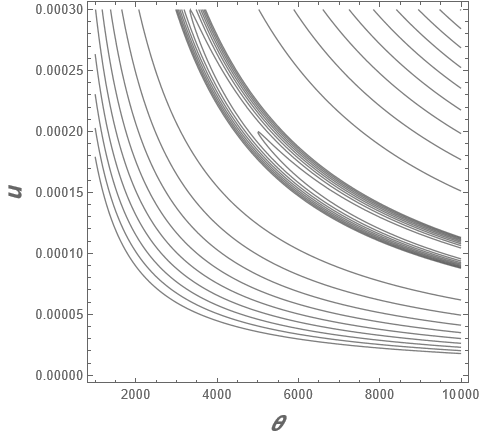
ContourPlot[logL /. y -> 10, {θ, 1000, 10000}, {u, 0, 3/10000},
Contours -> 
   Join[Range[-1.9, -1.1, 0.1], Range[-1.009, -1.001, 0.001]], 
ContourShading -> False, PlotPoints -> 50,
FrameLabel -> (Style[#, Bold, 18, Italic] &) /@ {"θ", "u"}]

Contour plot with alternative range of values for theta and u

One can see that the maximum is tending towards $\theta\rightarrow \infty$ and $u \rightarrow 0$.

Making the substitution of what you produced ($\hat{\theta}=1/\hat{u}$) into

$$\hat{u}=\frac{1}{\hat{\theta}+y}$$

results in

$$\hat{u}=\frac{1}{1/\hat{u}+y}$$

The solutions to that are $\hat{u}=0$ or $y=0$.

$\endgroup$
2
  • $\begingroup$ Thank you, forgot about the substitution part I guess. Thanks for the R-code! $\endgroup$
    – Faithhhhhh
    Commented Jan 25, 2023 at 18:06
  • 1
    $\begingroup$ Good. But the code is Mathematica rather than R. $\endgroup$
    – JimB
    Commented Jan 25, 2023 at 18:34

Your Answer

By clicking “Post Your Answer”, you agree to our terms of service and acknowledge you have read our privacy policy.

Not the answer you're looking for? Browse other questions tagged or ask your own question.