Understanding the Cox PH Model
The survival function under the proportional hazards assumption is
$$ S(t \mid X) = S_0(t)^{\exp(X\beta)} $$
So there are two parts you need to specify:
- The log hazard ratios $\beta$, and
- The baseline or reference survival function $S_0(t)$.
Once you have these, you can leverage the fact that $S(t\mid X) = 1-F(t\mid X)$ to draw survival times. Here, $F$ is the CDF of failure times.
Let's walk through this step by step.
Specifying the log hazard ratios
This is a fairly simple step. I'm going to simulate 2 continuous variables and 1 binary indicator. The continuous variables will have mean 0 and standard deviation 1. The binary indicator will have a prevalence of 0.5. I'll specify the effects of the continuous variables to be 1 and 0.325 on the log hazard ratio scale, and the effect of the binary variable to be 0.15 on the log hazard ratio scale.
library(tidyverse)
library(survival)

set.seed(0)
# No intercept in the cox model
N <- 25000
age <- rnorm(N)
sex <- rbinom(N, 1, 0.5)
weight <- rnorm(N)
X <- model.matrix(~age + sex + weight -1)
beta <- c(1, 0.15, .325)
xb <- X %*% beta
Specifying $S_0(t)$
The cox model is a semi-paremetric model, so it doesn't really matter what we choose here. I'm going to use a weibull distribution so that
$$S_0(t) = \begin{cases}e^{-(x / \lambda)^k}, & x \geq 0 \\ 0, & x<0\end{cases}$$
for appropriate choice of scale and shape. This will allow us to compare predicted survival curves against the true survival curves.
Drawing Survival Times
This is the tricky bit. $S_0(t)$ is the survival, which means $F(t) =1-S_0(t)$ is the CDF. To sample the survival times, we can
- Draw a uniform random variable, $u$. If we wanted to draw from the PDF of survival times, we would solve the equation $F(t) =u$ for t. This can be done by inverting the CDF or by root finding..
- Well, if $S_0(t)^{\exp(X\beta)}$ is our survival function, then $F(t \mid X) = 1-S_0(t)^{\exp(X\beta)} $ is our CDF, so we can solve $F(t \mid X) = u$ to get a draw from the survival time distribution.
We can also add censoring if we like. An event is considered censored if the failure time is larger than the censoring time. For simplicity, let's draw censoring times from the same distribution as the survival times.
finv = \(x, u, xb) (1-pweibull(x, 4, 5))^(exp(xb)) - u

failure_times <- rep(0, N)
censor_times <- rep(0, N)

for(i in 1:N){
  uu<-runif(1)
  cc<-runif(1)
  failure_times[i] <- uniroot(finv, interval=c(0, 20), u=uu, xb=xb[i])$root
  censor_times[i] <- uniroot(finv, interval=c(0, 20), u=cc, xb=xb[i])$root

}

time <- pmin(failure_times, censor_times)
event <- as.integer(failure_times<censor_times)
Fit the Model
Now, we just do the model fitting and compare against the parameters we specified
fit <- coxph(Surv(time, event) ~ age + sex + weight)
summary(fit)

Call:
coxph(formula = Surv(time, event) ~ age + sex + weight)

  n= 25000, number of events= 12464

           coef exp(coef) se(coef)      z Pr(>|z|)
age    0.986221  2.681085 0.011754 83.909   <2e-16 ***
sex    0.151580  1.163671 0.017949  8.445   <2e-16 ***
weight 0.319033  1.375797 0.009291 34.337   <2e-16 ***
---
Signif. codes:  0 ‘***’ 0.001 ‘**’ 0.01 ‘*’ 0.05 ‘.’ 0.1 ‘ ’ 1

       exp(coef) exp(-coef) lower .95 upper .95
age        2.681     0.3730     2.620     2.744
sex        1.164     0.8593     1.123     1.205
weight     1.376     0.7269     1.351     1.401

Concordance= 0.73  (se = 0.002 )
Likelihood ratio test= 7969  on 3 df,   p=<2e-16
Wald test            = 7474  on 3 df,   p=<2e-16
Score (logrank) test = 7533  on 3 df,   p=<2e-16
The immense sample size if the simulation ensures our estimates are very close to the truth, which they are.
Plotting $S_0(t)$ and The Known Survival Function
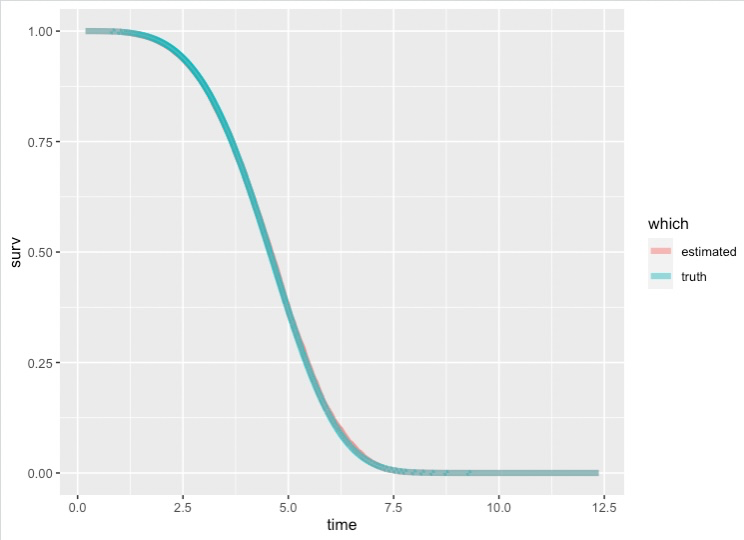
Like I said, $S_0$ corresponds to subjects who have 0 for all their covariates. We've cooked up this example so that $1-S_0(t)$ is the weibull CDF. We can plot the estimated survival curve against the weibull survival curve to prove this to ourselves.
fit <- coxph(Surv(time, event) ~ age + sex + weight)
summary(fit)


sfit = survfit(fit, newdata = list(age=0, sex=0, weight=0))


tibble(
  time=sfit$time,
  estimated = sfit$surv,
  truth = 1 - pweibull(sfit$time, 4, 5)
) %>%
  gather(which, surv, -time) %>%
  ggplot(aes(time, surv, color = which)) +
  geom_step(size=2, alpha = 0.5)
The two lines are nearly ontop of one another

Edit: How Good Was Our Estimate
We can bascially treat our estimated survival curve as a prediction and compute MSE and RSME
tibble(
  time=sfit$time,
  estimated = sfit$surv,
  truth = 1 - pweibull(sfit$time, 4, 5)) %>%
  summarise(
    mse = mean((estimated - truth)^2),
    rmse = sqrt(mean((estimated - truth)^2))
  )

# A tibble: 1 × 2
         mse    rmse
       <dbl>   <dbl>
1 0.00000900 0.00300
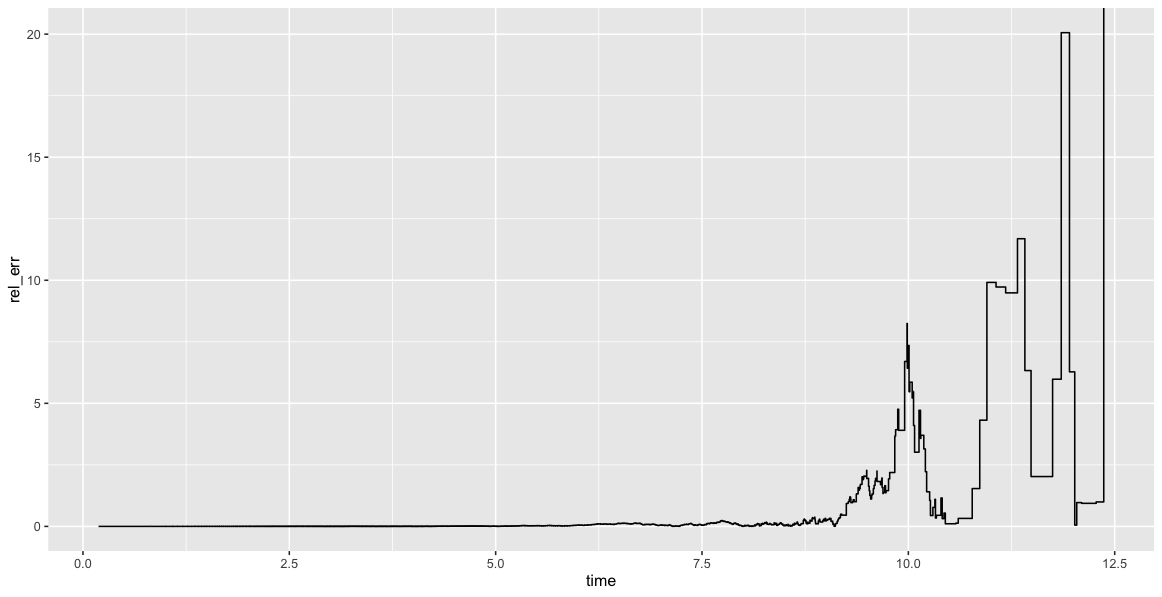
Or compute the pointwise relative error
tibble(
  time=sfit$time,
  estimated = sfit$surv,
  truth = 1 - pweibull(sfit$time, 4, 5)) %>%
  mutate(
    rel_err = abs(truth-estimated)/truth
  ) %>%
  ggplot(aes(time, rel_err)) +
  geom_step()
Bigger means worse approximation. I'm not surprised the tail is so bad, the probabilities are very small so any small change results in a large relative


