2
$\begingroup$

Suppose we have a continuous random variable $X$. We do not know its distribution function, but have $n$ i.i.d. samples.

I am looking for methods that quantize (discretize) $X$ into a categorical variable $\tilde{X}$ with $k$ level.

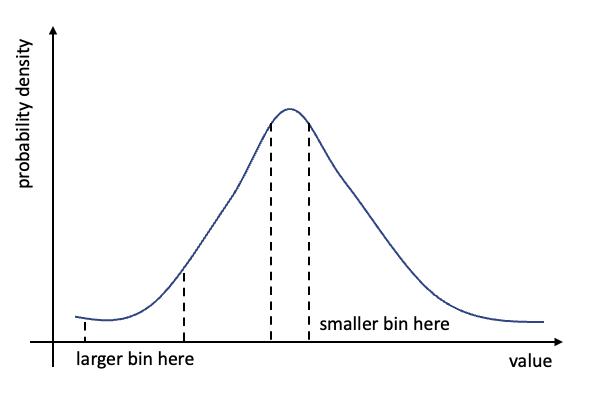
The most naive method is the uniform quantization, where each quantization bin has the same length. However, it seems more reasonable to set the length of bins according to empirical density of $X$, as shown in the below figure.

enter image description here

I think there must be some standard text that deals with my problem, but have not found one yet. I would be really grateful if you could point to an authoritative reference that covers this topic.

$\endgroup$
5
  • 2
    $\begingroup$ Why do you want to discretize your data? $\endgroup$ Commented Mar 27, 2023 at 6:46
  • $\begingroup$ If you want to approximate the density, bins of equal length seem the most reasonable choice (check ?hist in R) $\endgroup$
    – utobi
    Commented Mar 27, 2023 at 6:47
  • 2
    $\begingroup$ You can bin them by quantiles, then each bin will have equal density. $\endgroup$ Commented Mar 27, 2023 at 8:00
  • $\begingroup$ Thanks, binning by quantiles work! One may use pandas.qcut for implementation. $\endgroup$ Commented Mar 28, 2023 at 3:57
  • 1
    $\begingroup$ Every textbook on cartography I have seen (and I have a bunch) discusses this. Standard methods are equal intervals, equal areas (not relevant here, but hinting at the possibility of exploiting additional variables for the binning), quantiles, and "Jenks' method," which is just k-means clustering in 1D. Of course there are many other methods -- infinitely many. Which of these might be legitimate depends (very much) on the circumstances and your objectives. $\endgroup$
    – whuber
    Commented Mar 30, 2023 at 18:34

2 Answers 2

1
$\begingroup$

Binning a variable by percentiles with equal spacing will ensure intervals with the same density.

$\endgroup$
-2
$\begingroup$

It appears that you are looking for change points. Each change point becomes a bin boundary. The density is the number of points between change points, divided by the length of the bin.

Alternatively, you can do nearest neighbor smoothing, or lowess smoothing.

$\endgroup$
4
  • $\begingroup$ The usual meaning of "change point" requires paired data. It's unclear how smoothing would address the question. $\endgroup$
    – whuber
    Commented Mar 30, 2023 at 18:35
  • $\begingroup$ No, you can have change points in a univariate list (like a list of photon arrival times). See docs.astropy.org/en/stable/api/… for example. $\endgroup$
    – or GP
    Commented Apr 2, 2023 at 5:48
  • $\begingroup$ That requires the list to be ordered and for you to create a variable corresponding to the index of the ordering. Although you could order a sample from a random variable, almost any changepoint technique would be inapplicable due to the correlations induced by that ordering. $\endgroup$
    – whuber
    Commented Apr 2, 2023 at 12:52
  • $\begingroup$ Sure, but nothing in the original question says such an ordering is not possible. In fact, the presence of "value->" along the x-axis says that it is necessary. $\endgroup$
    – or GP
    Commented Apr 3, 2023 at 14:32

Your Answer

By clicking “Post Your Answer”, you agree to our terms of service and acknowledge you have read our privacy policy.

Not the answer you're looking for? Browse other questions tagged or ask your own question.