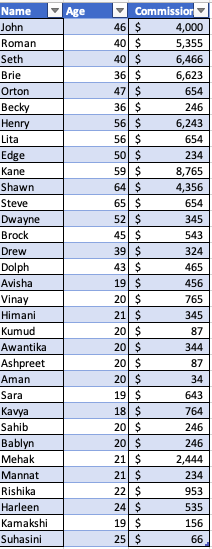
The data table for my company's salesmen/women commission for FY23 follows.
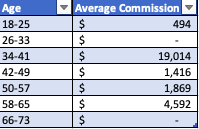
Below, I compare the commission of each age group to know which age group is performing well (which I don't think matters), and please notice the groupings are arbitrary and hence meaningless. I compare commission for each age group not intending to see any causal relationship or correlation but rather for a descriptive view, i.e. to gain a deeper understanding of the data. In short, I'm summarizing the data.
Problem: Before I take you toward the problem, I want to clarify a term: Comparison. To compare means to note differences and similarities in characteristics between two or more things. I always thought I can only compare individuals (which are names in this data set) on a certain characteristic: maybe I compare the age of each individual, the commission of each individual, the gender of each individual, the salary of each individual, shirt color of each individual, and what not "of" individuals. Now, it starts to dawn on me that I can compare even the characteristics of individuals to other characteristics: in this case, age group and commission are being compared. My question is, which is unintuitive to me since to compare is to describe the differences in characteristics of two or more things, how in the world is commission a characteristic of age groups? Am I thinking wrong?
P.S. Even though the answers provided by the community were far more intuitive, I still didn't follow them. It is because I didn't make myself clear, which was my fault. To right the wrong, I edit the whole question (including the title).


