I have a dataset from an experiment testing insect mortality with the following design:
- There are 5 doses of radiation (0, 150, 400, 750, 1000) which I scaled to 0, 0.15, 0.4, 0.75, 1 for model fitting purposes.
- There are 3 different treatments that may affect survival
- It is a randomized complete block design where insects housed individually were exposed to the radiation. In each of four blocks, there are 25 insects from each of the 15 treatment combinations. We expect the block effect to be minimal if not negligible.
- Mortality was checked every 3 or 4 days for about 60 days.
Looking at the data, it seems that there is a non-linear interaction between dose and treatment. Namely, at low doses treatment does not matter much because there is low mortality across all treatments. At intermediate doses, there is a difference in mortality between treatments. At high doses, once again we see no difference between the treatments because the flies are exposed to such high radiation that the protection provided by the treatments is not adequate anymore.
My modeling approach
- I decided given the data that the blocking factor was negligible so I am ignoring it in the model.
- I am modeling the data as interval-censored because we do not know exactly what day each insect died. We only know it within 3 to 4 days. Also, some individuals survived after the end of the measurement period so they are treated as right-censored.
- I'm trying to fit a parametric survival model here, specifically a Bayesian interval-censored proportional hazards model. I included treatment (
exposure) and its interaction with dose (ebeam_strength) as predictors. I also included second-order quadratic term for dose so that I can potentially capture the nonlinear interaction where we only have treatment difference at intermediate doses. - I am using the function
ic_bayes()from the R package icenReg.
Example of data
Here are the first and last few rows of the dataset ebeam_surv showing some individuals who were still surviving at the end of the measurement period and some who died at different times.
      ebeam_strength exposure rep id lower_bound upper_bound death
   1:              0     Tube   1  1           0           2     1
   2:              0     Tube   1  2          65          NA     0
   3:              0     Tube   1  3          65          NA     0
   4:              0     Tube   1  4           2           6     1
   5:              0     Tube   1  5          65          NA     0
  ---
1356:              1  Bare PW   4 18          30          34     1
1357:              1  Bare PW   4 19          34          37     1
1358:              1  Bare PW   4 20          27          30     1
1359:              1  Bare PW   4 21          13          16     1
1360:              1  Bare PW   4 22          20          23     1
R code used to fit model
ic_fit <- ic_bayes(Surv(time = lower_bound, time2 = upper_bound, type = 'interval2') ~ exposure * poly(ebeam_strength, 2),
                   data = ebeam_surv, model = 'ph', dist = 'weibull')
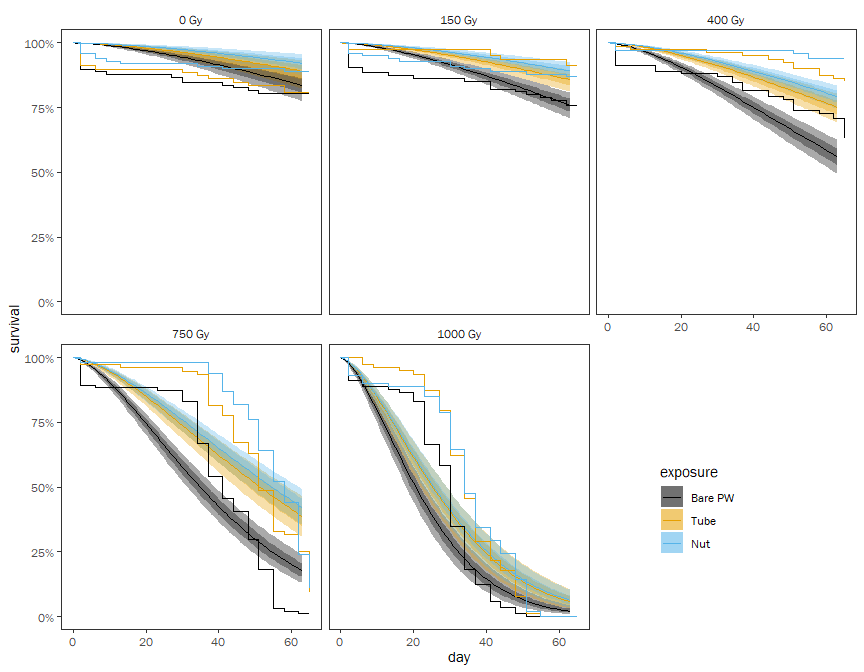
Plot of model fits superimposed on raw data
Here you can see the raw data averaged across reps, with the posterior median fitted survival curves and 66% and 95% shaded quantile credible interval regions around them. We are picking up the interaction between dose and treatment but some of the fitted curves are poorly fitting the data.
My problem
I think that the model is capturing the nonlinear interaction between treatment and dose. However I see that the parametric distribution is not fitting the data very well. In particular, it seems like mortality is low for a few weeks then quickly accelerates, especially in the high doses. But the Weibull distribution doesn't really seem to be fitting that. I tried other baseline distributions but I cannot come up with one that provides a better apparent fit to the data.
How can I improve the model to get a better fit to the observed data? Is there some nonparametric model I can fit that will still detect the interaction? I am willing to ignore the interval-censored nature of the data if that is necessary to get a better fit.


discSurvpackage simplifies the data formatting. Then you perform a binomial regression of the event against the covariates, including time as a predictor. Keeping it as a categorical predictor is similar to the Cox model idea of not imposing a parametric form on the baseline hazard, but you can model time parametrically if you wish. See this page and its links. $\endgroup$