10
$\begingroup$

I am doing some research about forecasting time series of probability density functions. We are aiming to forecast a PDF given historically observed (usually, estimated) PDF. The forecasting method we are developing performs pretty well in simulation studies.

However, I need an numerical example from real applications to illustrate our method further. So, are there any proper examples in applications (finance, economics, biology, engineering, etc.) where a time series of PDFs are collected and it is important and difficult to forecast such a time series?

$\endgroup$
2
  • 1
    $\begingroup$ Try income distribution. It is certainly important to estimate it and forecast it. I would certainly be interested to see results. $\endgroup$
    – mpiktas
    Commented Jul 1, 2013 at 10:49
  • 1
    $\begingroup$ The Bank of England releases density forecasts of inflation. You can find more info here: "Evaluating the Bank of England Density Forecasts of Inflation". Michael P. Clements The Economic Journal Vol. 114, No. 498 (Oct., 2004), pp. 844-866. $\endgroup$
    – user603
    Commented Feb 22, 2014 at 9:35

3 Answers 3

4
$\begingroup$

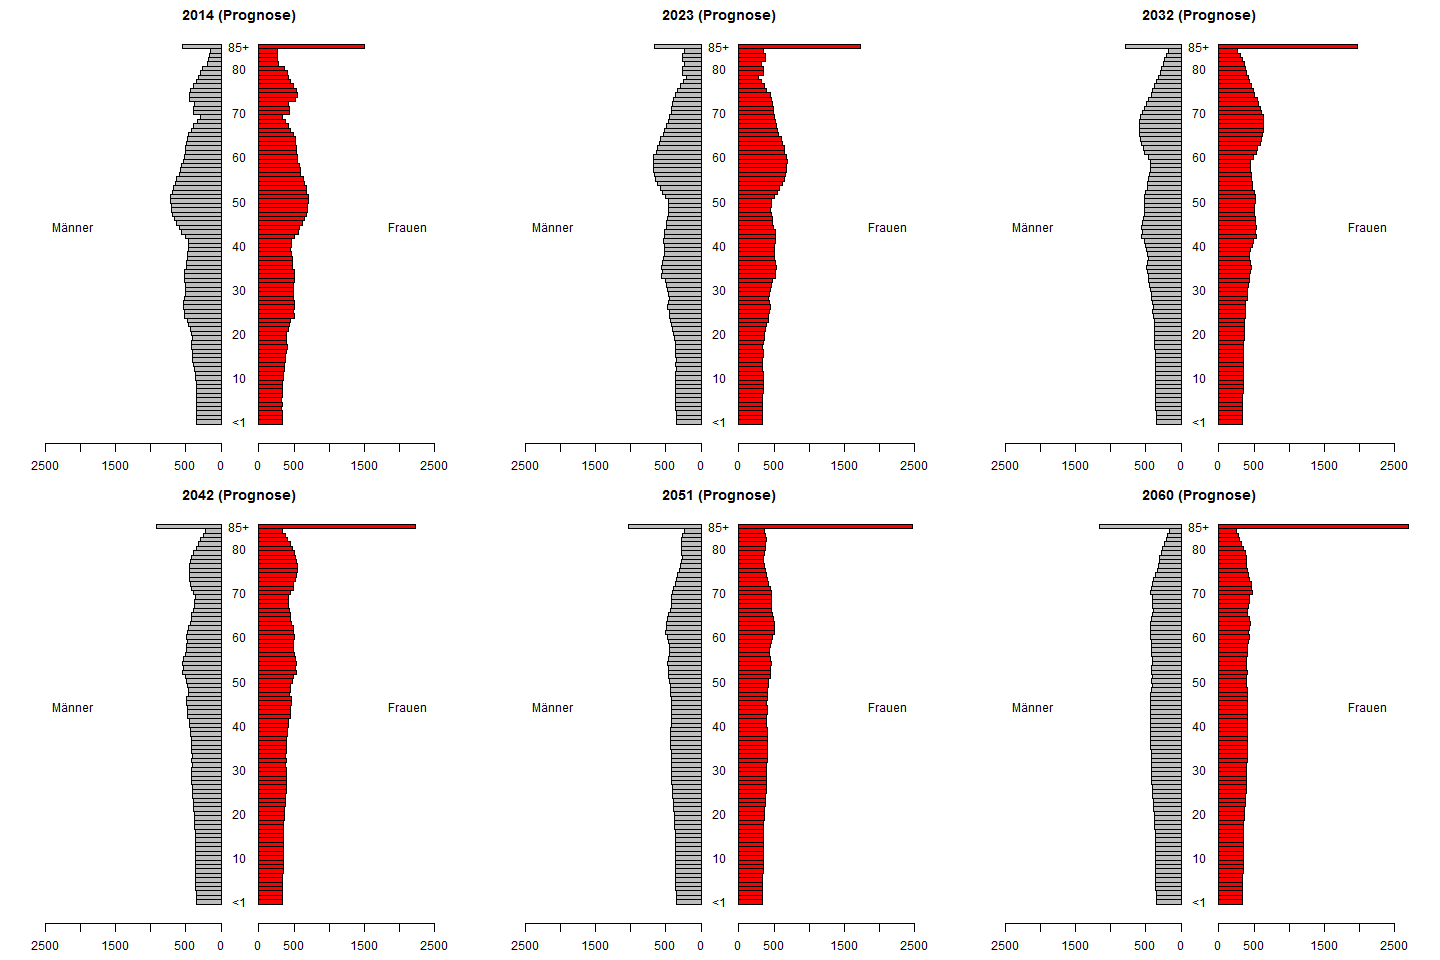
One important application lies in demographics, e.g., forecasting the development of age pyramids, which are really nothing but time-varying histograms, which in turn are density estimators. Try your approach on that.

Here are a few ideas about how to get longitudinal demographic density data. I finally went with the German dataset, which had the finest granularity, giving the annual pyramid in 1-year steps - most other datasets only binned each year's pyramid in 5-year-age bins. If you find a better source of demographic density time series, please tell us at that thread.

Hyndman and Shang (2009) is a paper on forecasting functional time series. They apply their method to fertility rates.

I'd also recommend the rainbow package for R also by Shang and Hyndman, for visualization of functional data.

Or you can visualize your forecasts using animations. Here is a little animated GIF I created for the future German population pyramid (men on the left, women on the right):

forecast

$\endgroup$
1
$\begingroup$

There's a growing interdisciplinary literature on forecasting probability densities (as opposed to just forecasting the mean of a series). The following reference is a recent survey which discusses both methodology and applications in economics, meteorology, etc.

Gneiting, T. and M. Katzfuss (2014): "Probabilistic Forecasting", Annual Review of Statistics and Its Application 1, 125-151.

Available at http://www.annualreviews.org/doi/abs/10.1146/annurev-statistics-062713-085831

$\endgroup$
1
  • $\begingroup$ The Gneiting and Katzfuss paper is a good one. However, the OP is not looking to forecast a predictive density from a time series of historically observed single data points. At each point in the past, he has observed a complete density. He is interested in forecasting how this entire density will evolve. Thus, this answer unfortunately misses the mark. $\endgroup$ Commented Nov 13, 2015 at 14:10
0
$\begingroup$

In fixed-income finance, you can observe the term structure time series of an asset. Concretely, for credit default swaps, how much you have to pay to get insured against a company's default for $t$ years. This price is directly linked to the probability of default of the company.

At instant $t=0$ the probability of default is $P(t=0) = 0$, at instant $t=\infty$ the probability of default is $P(t=\infty) = 1$, in between it is nondecreasing. You thus have a cumulative distribution function, and by derivation a probability density function. Since you can observe this curve on a daily basis, you have a time series of PDF which may have interesting dynamics.

Tell me if you are interested by a more detailed story about that.

$\endgroup$

Your Answer

By clicking “Post Your Answer”, you agree to our terms of service and acknowledge you have read our privacy policy.

Not the answer you're looking for? Browse other questions tagged or ask your own question.