2
$\begingroup$

I would like to understand the difference between simple R², predicted R², and adjusted R². I have done several research and readings, but the difference is still not clear to me. I have even reached some conclusions, but I'm not sure about my understanding. R² is a metric that ranges from 0 to 1 and measures how much the independent variables explain the variability in the dependent variable. Predicted R² follows the same logic as R² but is applied to a dataset that was not used to train the model, meaning it is applied to test data.Adjusted R² is a modified version of R² that penalizes unnecessary predictor variables.

My question is: Given that the predicted R² is applied to new data, i.e., test data, does this mean that simple R² and adjusted R² should be applied to training data? Does that make sense? I've seen different discussions on this, but I haven't found a common consensus. The most I found is that applying R² to the training sample and comparing it to the result of applying it to the test sample helps detect overfitting. There are some discussions in the forum about this, but the issue of overfitting is not my concern. I want to understand which input data makes more sense to use for each metric, whether it's training and/or test data. If anyone has any articles or theoretical reference books to recommend for further study, I would also appreciate it.

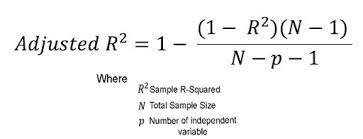
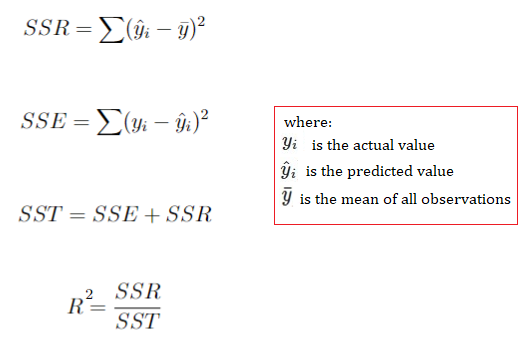
I am assuming the following formula for R² and adjusted R². For predicted R², I haven't found a specific formula so I imagine it should be the same formula as R², with the only difference being the input data, where in R² it would be the training data, and in predicted R², it would be the test data, but again, I'm not sure if this conclusion is correct.

enter image description here

enter image description here

$\endgroup$
4
  • $\begingroup$ Welcome to Cross Validated! What are the equations for these $R^2$ values? $\endgroup$
    – Dave
    Commented Oct 25, 2023 at 2:59
  • $\begingroup$ Hi @Dave! Thank you for the welcome. I edited my question and added information about the formulas I am using $\endgroup$
    – guest
    Commented Oct 25, 2023 at 7:28
  • $\begingroup$ Thanks for adding those! What, then, is the predicted $R^2?$ $\endgroup$
    – Dave
    Commented Oct 25, 2023 at 9:23
  • $\begingroup$ @Dave For predicted R² I haven't found a specific formula so I imagine it should be the same formula as R², with the only difference being the input data, where in R² it would be the training data and in predicted R² it would be the test data, but I'm not sure about this $\endgroup$
    – guest
    Commented Oct 25, 2023 at 15:17

1 Answer 1

2
$\begingroup$

The usual $R^2$ is a transformation of the sum of squared residuals that compares the sum of squared residuals of your model (a measure of by how much your model misses the observed values) to the sum of squared residuals of a reasonable baseline model.

$$ R^2 = \dfrac{SSR}{SST} = \dfrac{SST - SSE}{SST} = 1 - \dfrac{SSE}{SST}=1-\left(\dfrac{ \overset{N}{\underset{i=1}{\sum}}\left( y_i-\hat y_i \right)^2 }{ \overset{N}{\underset{i=1}{\sum}}\left( y_i-\bar y \right)^2 }\right) $$

(The $SST = SSR + SSE$ winds up breaking down once you leave ordinary least squares linear regression, so I would see $R^2$ in terms of that final expression in the line.)

However, the numerator of this fraction can be driven quite high by modeling the errors instead of the underlying pattern, that is, coincidences in the data used for model-fitting instead of the true trend. Adjusted $R^2$ penalizes high parameter counts that tend to lead to this kind of behavior, using the calculation here that is algebraically equivalent to what you gave.

For predicted $R^2$, that sounds like applying the $R^2$ formula to out-of-sample data, which is what sklearn.metrics.r2_score calculates. However, I disagree with the sklearn implementation, as the denominator in sklearn will use the out-of-sample $\bar y$, while I believe it should be the in-sample $\bar y$, a stance supported by the modern statistics literature (Hawinkel, Waegeman & Maere (2023)).

It doesn't make sense to me to apply adjusted $R^2$ to out-of-sample data. The idea is to transform the usual $R^2$ in a way that penalizes using many parameters because of how that risks fitting to the noise, which an out-of-sample $R^2$ already does. Further, as you get into sophisticated predictive models, it becomes unclear how to calculate the degrees of freedom.

REFERENCE

Stijn Hawinkel, Willem Waegeman & Steven Maere (2023) Out-of-sample $R^2$: estimation and inference, The American Statistician, DOI: 10.1080/00031305.2023.2216252

$\endgroup$

Your Answer

By clicking “Post Your Answer”, you agree to our terms of service and acknowledge you have read our privacy policy.

Not the answer you're looking for? Browse other questions tagged or ask your own question.