3
$\begingroup$

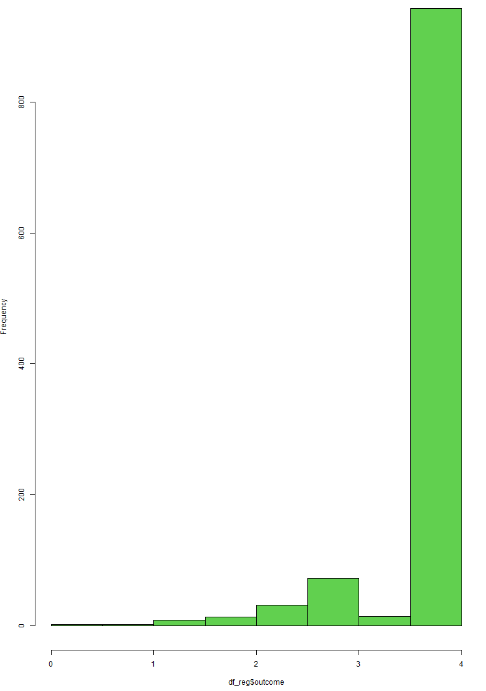
I have the dataset with the following situation. My dependent variable (Y) is decimal and has non-parametric distribution (shapiro test p-value<0.05) and the current variable has a determinated value with high frequency (score > 3.91 = 938, score <3.91 = 120) . I would like to perform multiple regression model to identify the effect of some predictors.

Is razonble use logistic regression for this situation?

Umbalanced data could affect the generalization of log.regression?

summary(df_reg$outcome)

Min. 1st Qu.  Median    Mean 3rd Qu.    Max.    NA's
0.4399  3.9199  3.9199  3.7305  3.9199  3.9199     361

enter image description here

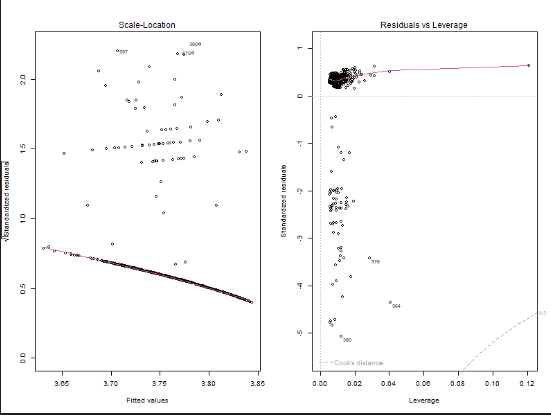
The results of Cook Distance and Residuals Distribution of multiple linear regression are here: enter image description here
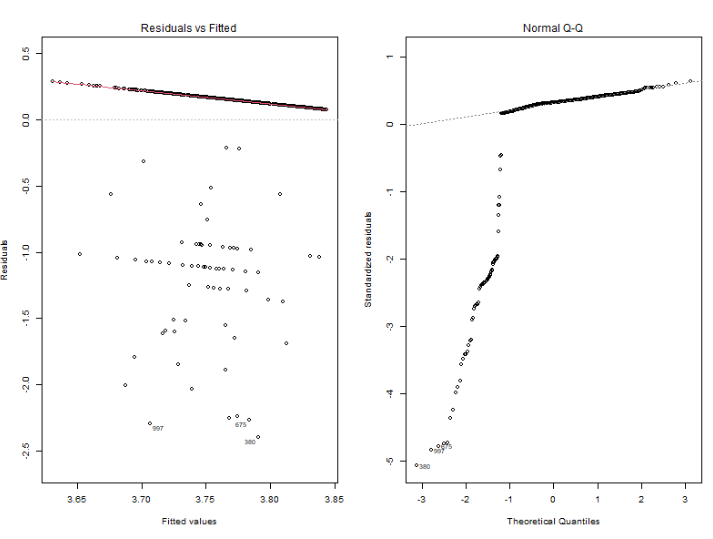
enter image description here

$\endgroup$

2 Answers 2

8
$\begingroup$

Logistic regression is for categorical outcomes; the "usual" form of logistic reg. is for dichotomous outcomes. So, you could divide your outcome into 3.9199 and everything else and then do logistic reg. But this treats every value that is less than 3.9199 identically and that may not be what you want.

Ordinary least squares regression does not require a normally distributed outcome; it makes assumptions about the error term, which we approximate with the residuals from the model, so you would first have to look at those. If those are, in fact, very non-normal (which seems kind of likely) then you could look at robust regression or quantile regression, which do not make assumptions about the error.

But, first, I suggest thinking about the outcome and whether there is some better way to measure it. What is it? Why does it take this particular value in more than 3/4 of the cases? Also, why is it missing a bunch of times?

$\endgroup$
3
  • $\begingroup$ Peter, thanks for your early answer. The outcome is a Phsicometric value at the lowest level of difficult. So, many people obtain good results. I have attached the results of residuals in multiple linear regression with lm() function in R. $\endgroup$
    – ronald
    Commented Nov 29, 2023 at 14:30
  • 2
    $\begingroup$ Well, could you use the value at a higher level of difficulty? But only you can tell if logistic regression meets your needs. $\endgroup$
    – Peter Flom
    Commented Nov 29, 2023 at 14:44
  • $\begingroup$ Logistic regression seems like a good first step here for separating the mode and non-modal values. You could then use another type of regression model to distinguish between the non-modal values. $\endgroup$
    – user3490
    Commented Nov 30, 2023 at 7:58
9
$\begingroup$

Ordinal regression might be a good choice here. Chapter 13 of Frank Harrell's Regression Modeling Strategies explains this approach. It makes no assumptions about the distribution of outcomes, working just with their rankings. There is an assumption about how the linear predictor from the regression is associated with progressively higher outcome values. A typical assumption is an extension of logistic regression to multiple ordered outcomes.

Although ordinal logistic regression is often thought to be restricted to a small set of ordered outcomes, as illustrated on this page, it can be used effectively with thousands of outcome levels. It also can deal with the stacking up of values at ends of the scale, as in your data. The orm() function in the R rms package provides an efficient implementation.

$\endgroup$
1
  • 1
    $\begingroup$ EdM , the provided link in the post is an interesting and fundamental review of ordinal logistic regression. Thank you for share the link of Frank's article. $\endgroup$
    – ronald
    Commented Nov 30, 2023 at 23:13

Your Answer

By clicking “Post Your Answer”, you agree to our terms of service and acknowledge you have read our privacy policy.

Not the answer you're looking for? Browse other questions tagged or ask your own question.