0
$\begingroup$

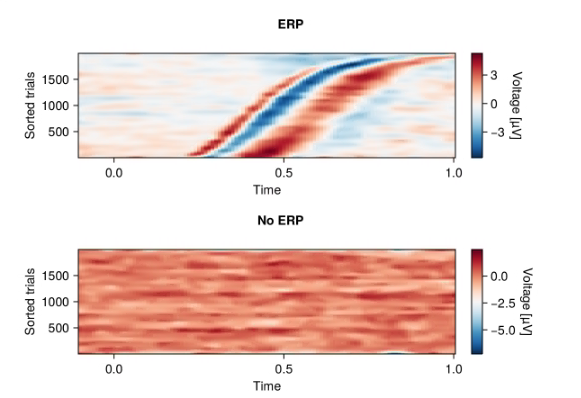
I have two images from erp_data and noerp_data matricies. In erp_data we can see a pattern (sigmoid), in no_erp we see no pattern. ERP is event-related potential, if you are curious. enter image description here
My goal is to find a metric that detects patterns. I used entropy to determine if there is structure in the data. If there is structure, the entropy should be high; if not, it should be low. However, I am seeing the opposite results here: enter image description here
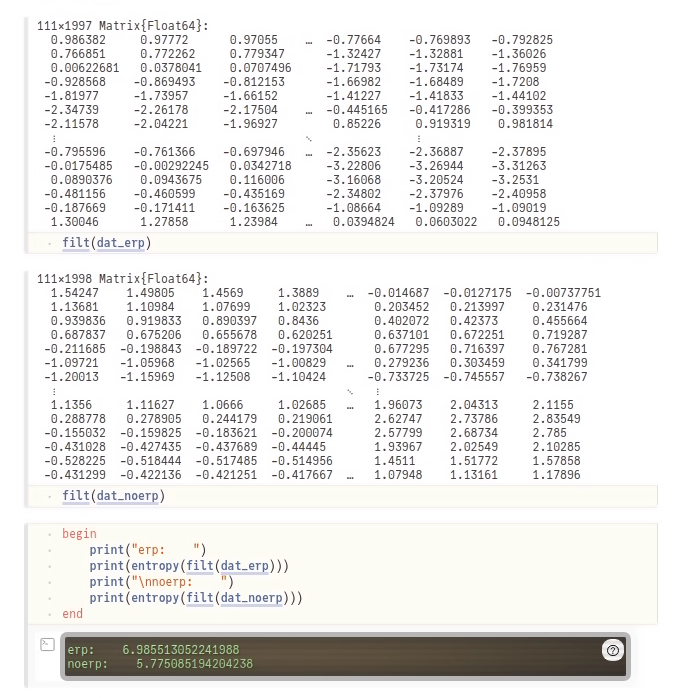
Why is that?

Additional more broad question: what kind of other metrics could you recommend instead of entropy?

$\endgroup$
3
  • $\begingroup$ On what basis are the trials sorted and what specifically do you mean by a "pattern"? After all, virtually any method of sorting the rows according to some property of each row will yield a visualization that does not appear random. $\endgroup$
    – whuber
    Commented Mar 1 at 15:22
  • $\begingroup$ Pattern here is sigmoid (bright blue). Trials sorted on the basis of fixation duration (but I don't think it is important here) $\endgroup$ Commented Mar 1 at 18:05
  • $\begingroup$ I suspect it would be critically important, because "pattern detection" based on entropy requires evaluating local neighborhoods of each pixel, which are completely determined by the sorting. (If you aren't paying attention to neighborhoods, then there isn't anything left of the "pattern" apart from the frequencies of the possible pixel colors.) See stats.stackexchange.com/questions/17109 for a basic example of how this works. $\endgroup$
    – whuber
    Commented Mar 5 at 22:34

0

Your Answer

By clicking “Post Your Answer”, you agree to our terms of service and acknowledge you have read our privacy policy.

Browse other questions tagged or ask your own question.