0
$\begingroup$

I'm looking at Norwegian export data to try to detect sanctions evasion by Russia. Sanctions evasion takes place by the export of goods to third-party countries that in turn re-export the goods to Russia. The data have a monthly resolution, and they are highly granular in terms of categories of goods. I want to know whether there is a statistical test I can use that can detect significant changes in exports after February 2022 compared to before. I would like to use that test to check each individual export category for a number of third-party countries in order to know what to take a closer look at.

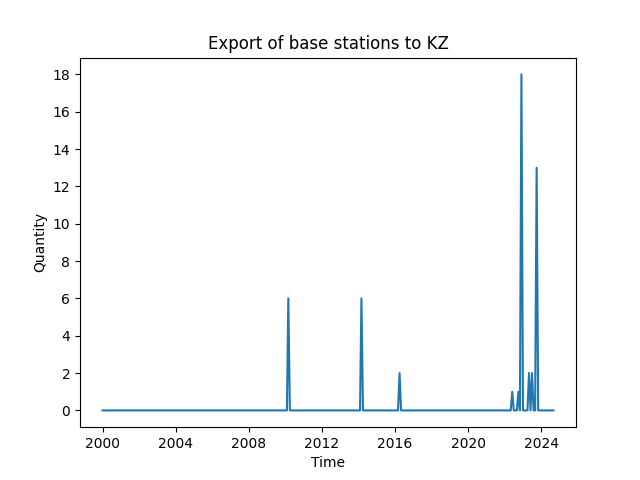
Below I've plotted a time series of exports of base stations (telecom equipment) to Kazakhstan:

A plot showing the monthly number of base stations exported to Kazakhstan

This is a typical example of what the data in the dataset looks like. You can see that most of the monthly values are zero, with a few non-zero values. The values are discrete, with only whole numbers.

$\endgroup$

2 Answers 2

1
$\begingroup$

I'm assuming you are asking because you have lots of series to analyze and you can't just eyeball each one. You want a principled approach.

The changepoint package in R has the cpt.meanvar() function which can identify changes in Poisson distributed data. The main assumption of the Poisson that is often violated in data is that the mean and the variance is the same. Your problem here is the zeroes, we would usually call this "zero-inflated" and you can search for information on these types of models.

The cpt.meanvar function will fit a Poisson model to each segment and identify the changepoints. The challenge is that those isolated months with nonzero value will also be identified as changes - although probably not the 2016 one based on a few simulations I ran with similar values.

If you are happy with the assumptions, you could post-process the changepoints and remove segments of length 2 as "outliers". This would probably give you what you want. If it doesn't then you need to think more about what an appropriate model for each segment could be that accounts for the zeroes.

$\endgroup$
0
$\begingroup$

Well, anyone who looks at your data (thanks for providing btw) and has at least 1 eye, should know immediately that something "suspicious" happened after 2022.
But now you have to prove this to your boss (or rather the boss of the boss of your boss), with some appropriate statistical mumbo-jumbo, which said boss of the boss of the boss will not understand, but which he/she will find convincing.
OK, so you only have shipments per month. You can pehaps reduce this to shipments per day? (taking into account the days where shipping does not occur -week-ends, holidays, etc.??-). E.g before 2022, you had 14 shipments out of ~4000 days. After 2022, you have ~37 shipments out of ~700 days (I am eyeballing it but I should be in the ballpark, and as you will see later, it does not really matter). These go in a 2x2 contingency table, and your p-value is a big, fat 0 (ok very close to 0, no matter which test you use: Fisher-exact, $\chi^2$, etc.). You can also do it by month, and get the exact same answer ($p\approx 0$). You can also look at the proportions (shipments per some unit of time, which will be fractional), and use a z-test of 2 proportions, and still get a significant result.
xkcd has this great cartoon which states that one should "always try to get data that is good enough that you don't need to do statistics on it". Well, pat yourself on the back, you just did it.
You can use a similar approach (comparing frequency of shipments of goods, before and after), for all your categories of goods.

$\endgroup$

Your Answer

By clicking “Post Your Answer”, you agree to our terms of service and acknowledge you have read our privacy policy.

Not the answer you're looking for? Browse other questions tagged or ask your own question.