6
$\begingroup$

I am using MAD as a measure of the spread of different distributions of numeric data, and some of these distributions have MAD of 0. I am curious, how is this possible? If I understand correctly, MAD is a measurement of the variability of a data set. I checked, and not all of the observations for those data sets are the same. So how can MAD be zero if this is the case?

For those curious, I am using the mad() function in R.

$\endgroup$
1
  • $\begingroup$ MAD can be confused with Mean Absolute Deviation. $\endgroup$ Commented Nov 13 at 12:35

3 Answers 3

12
$\begingroup$

MAD=0 means that the median of the data's absolute deviation from the median is zero. This does not imply that all the data points are the same or that the variance is zero. What it does imply is that zero is the "middle" absolute deviation, and since there can't be an absolute deviation any lower than zero, at least half of the data points have zero deviation from the median - at least half the data points are the median. Since at least half of your data points have zero deviation from the median, the MAD must also be zero.

MAD is just one measure of variability. A MAD of zero does not imply that all other measures of variability, like the variance or mean absolute deviation, will also be zero. Most measures of variability will take a value of zero when applied to invariant constant data, but the reverse isn't necessarily true - some measures, like MAD, may take a value of zero without implying invariance.

$\endgroup$
2
  • 2
    $\begingroup$ +1 also compare this to mean absolute deviation, which is only zero when all of the points are the same. $\endgroup$
    – Dave
    Commented Nov 12 at 16:45
  • 1
    $\begingroup$ @imky if this answers your question, please accept it as the answer $\endgroup$
    – EdM
    Commented Nov 12 at 17:15
3
$\begingroup$

An example of a non-trivial distribution with a median absolute deviation of zero is a Bernoulli distribution with parameter $p\not = \frac12$.

Similarly you could consider a binomial distribution with parameters $n,p$ where $p>\sqrt[n]{\frac 12}$ or $p< 1- \sqrt[n]{\frac 12}$.

Another is a Poisson distribution with parameter $\lambda < \log_e(2) \approx 0.693$.

In all of these examples there is a value which has probability of occurring greater than $\frac12$ so it is the median and has more than half the distribution $0$ distance from the median (the values of $0$ or $1$ for the Bernoulli, $0$ or $n$ for the binomial, $0$ for the Poisson).

$\endgroup$
0
$\begingroup$

Heavily borrowing from previous answers, here's an example:

set.seed(1)
x <- 10 + rpois(1000, lambda=log(2))

Histogram of variable x

xmad <- mad(x)
hist(x, main=sprintf('Median abs dev: %.2f', xmad))
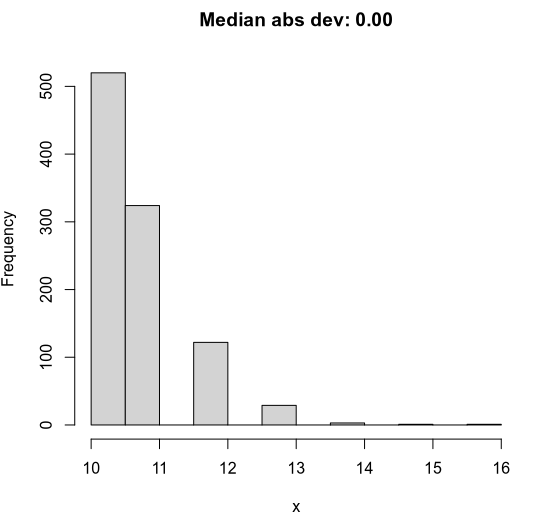
histogram of x

If you count the distinct values in x you see that 10 makes up more than 50% of the datapoints:

# Counts of distinct values in x
table(x)
x
 10  11  12  13  14  15  16 
520 324 122  29   3   1   1 

# As percentage
table(x) / length(x)
x
   10    11    12    13    14    15    16 
0.520 0.324 0.122 0.029 0.003 0.001 0.001

This means that more than 50% of the values will have absolute deviation of 0 and therefore the median absolute deviation from the median of x will be 0.

Here's another random draw from the same distribution where instead the mad is different from zero:

set.seed(1234)
x <- 10 + rpois(1000, lambda=log(2))
mad(x)
[1] 1.48

table(x)
x
 10  11  12  13  14  15 
482 358 117  37   5   1 

table(x) / length(x)
x
   10    11    12    13    14    15 
0.482 0.358 0.117 0.037 0.005 0.001 
$\endgroup$
1
  • $\begingroup$ Bottom line: Sample quantiles should only be used for continuous data with very few ties. Mean absolute difference doesn’t have this problem. $\endgroup$ Commented Nov 14 at 12:38

Your Answer

By clicking “Post Your Answer”, you agree to our terms of service and acknowledge you have read our privacy policy.

Not the answer you're looking for? Browse other questions tagged or ask your own question.