2
$\begingroup$

I'm having trouble to fit and simulate a gamma distribution using the fitdistr function from the MASS package:

My data is daily rainfall, so i 'm adding 1 to all points to get rid the 0's:

require(MASS)
rainfall = scan('daily_rainfall_january.txt', '')

rainfall = rainfall + 1
# sometimes i get warnings here (NA produced)
fit = fitdistr(rainfall, 'gamma')

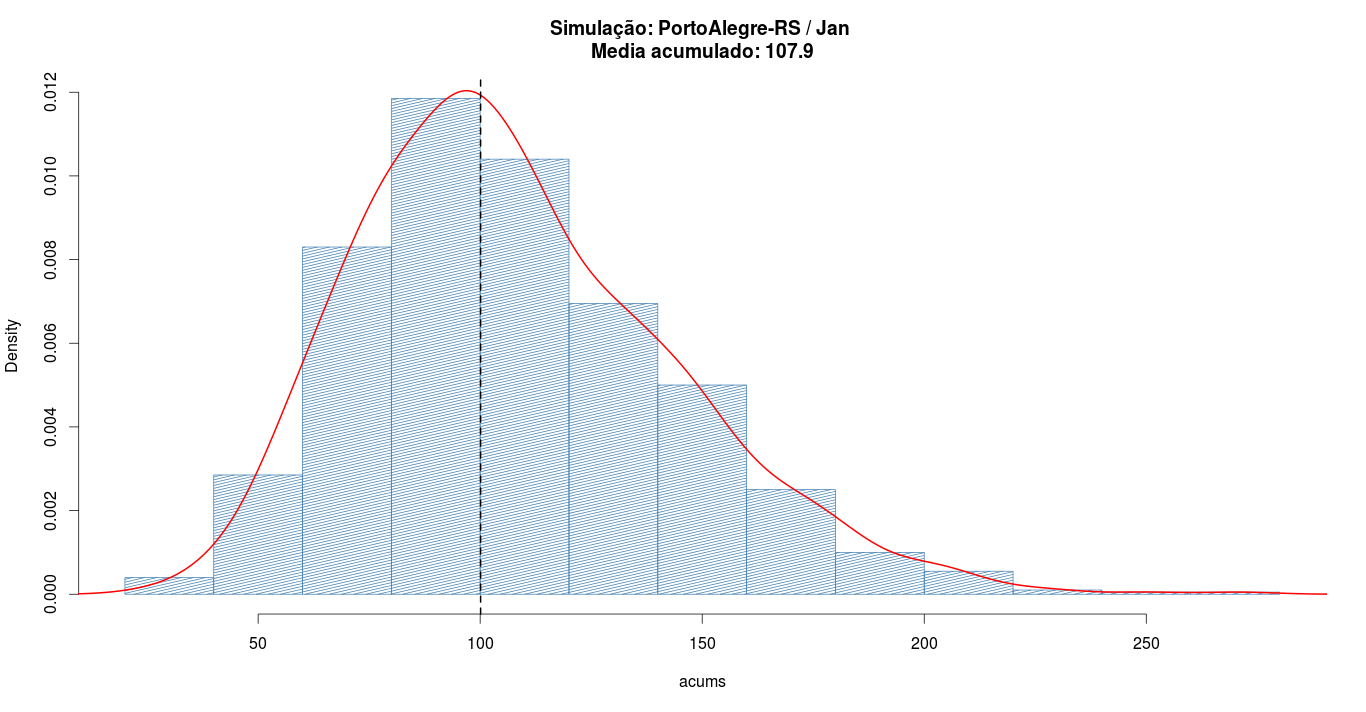
Now i want so simulate a January rainfall: (plot shows the accumulated rainfall over N simulations)
enter image description here

1 - Blue and red: output from 1000 rgamma simulations

2 - Dark line: 30 year climatology mean (monthly accumulated rainfall)

shape = fit$estimate['shape']
rate = fit$estimate['rate']
rainfall.simul = rgamma(31, shape = shape, rate = rate)

Now, how do i transform back rainfall.simul? Is there a better way to handle the 0's problem?

$\endgroup$
7
  • 2
    $\begingroup$ It seems unlikely a Gamma would fit daily rainfall records (except by accident for a sufficiently small dataset): there will be too many days in which no rain at all occurred. These true zeros have zero probability no matter what the parameters may be. Could you share with us your reasons for fitting a distribution? What do you hope to accomplish by that? $\endgroup$
    – whuber
    Commented Sep 16, 2013 at 20:56
  • $\begingroup$ To estimate the probability density for the daily rainfall forecast...Is it bad to transform the data in this case? I have nearly 11 years of daily data (~ 4500 points). I added '0.1' instead of '1' to the series, then ran a simualtion for each month: for some places/months, i got a pretty good fit (compared against a 30 year climatology mean). $\endgroup$
    – Fernando
    Commented Sep 16, 2013 at 21:06
  • 1
    $\begingroup$ Fitting a univariate distribution won't really help you run a realistic simulation, because rainfall has such strong temporal correlation (on several scales) and seasonality. Instead of trying to model all that parametrically, why not use the historical data more directly? Incidentally, reproducing a mean in your simulation tells you next to nothing about the goodness of the fit. $\endgroup$
    – whuber
    Commented Sep 16, 2013 at 21:11
  • $\begingroup$ What do you mean by more directly? I'm using a gamma to simulate each month, not the whole year, which would be clearly absurd. $\endgroup$
    – Fernando
    Commented Sep 16, 2013 at 21:14
  • 2
    $\begingroup$ Your simulations therefore (according to your description) exhibit none of the important time patterns present in the actual rainfall record. I don't want to recommend anything because I don't know what you're doing with these simulations, but--just as an example--you could draw a random value for a given date from the values for the same date during the 30 preceding years. For the next date you could flip a coin and depending on its outcome choose a value for that date from the same year or else from another random year. That's easy to do and produces a far more realistic simulation. $\endgroup$
    – whuber
    Commented Sep 16, 2013 at 21:19

2 Answers 2

1
$\begingroup$

You should maybe look into zero-inflated gamma models. Some examples with R code, here a variant with jags/bugs code, here with the gamlss R package.

There is also a lot of modeling advice for your particular rainfall data in the comments.

$\endgroup$
1
$\begingroup$

A simple approach, although not as elegant and rigorous as possible, would be to estimate the probability that there is no rainfall, fit a gamma to the amount of rain conditional that there is rain, and then simulate by only drawing the fitted gamma if the "rain indicator" variable is greater than the cutoff.

A more rigorous way would be to set up a hierarchical Bayesian model is something like rstan which reflects this choice.

$\endgroup$

Your Answer

By clicking “Post Your Answer”, you agree to our terms of service and acknowledge you have read our privacy policy.

Not the answer you're looking for? Browse other questions tagged or ask your own question.