I am doing bioinformatics and I am trying to fit some values to a log-normal distribution with python's sciPy version 0.11. According to the skew of the resulting distribution, I would like to make a 0-1 decision, i.e. if skew is positive, give a "0" value, as most of the data is on the left, while, if skew is negative, give a "1" value, as most of the data is on the right.
While trying to implement that, I am confused as to which formula to use for the skew. From Wikipedia, the skew is equal to: $(e^{\sigma^2}+2)\sqrt{e^{\sigma^2}-1}$, but this can never be a negative number. Using sciPy's moment method like this: scipy.stats.moment(data,3)/(std**3), seems to yield negative numbers, but then I found out this is the non-central moment, so I am afraid it is wrong.
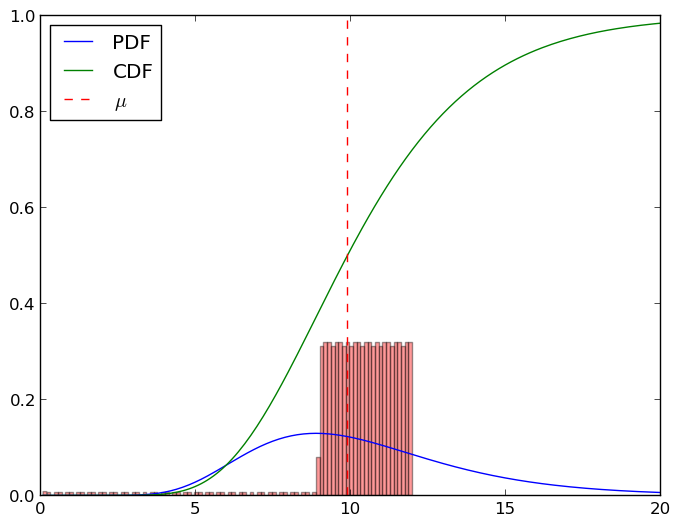
Secondly, I have looked into this very useful question here, on how to actually fit data to the log-normal distribution. I have tried to make a toy example, where I generate 50 numbers on the interval $0.1-9$ and 1000 numbers on the interval $9-12$. So, I would expect that this distribution should have a negative skew. The code is as follows:
import numpy as np
import scipy.stats as s
from matplotlib import pyplot as plt
test1 = np.linspace(0.1,9,50)
test2 = np.linspace(9,12,1000)
test = list(test1) + list(test2)
shape,loc,scale = s.lognorm.fit(test,floc=0)
distro = s.lognorm(shape,loc,scale)
x = np.linspace(0.1,20,200)
plt.plot(x,distro.pdf(x))
plt.plot(x,distro.cdf(x))
plt.axvline(x=scale,color='r',ls='--')
plt.legend(('PDF','CDF',r'$\mu$'), loc='upper left')
plt.hist(test,bins=100,normed=True,alpha=0.4)
And the corresponding image:

My question is, does it really take that much to shift a log-normal distribution to the right? What I have done here seems to spread it wide, but shift it only a little. Should I use a different measure for my purposes?
