What is a Gaussian Discriminant Analysis (GDA)? What materials should one read to understand how a GDA works and where it comes from? Try to explain this for someone at a high-school level.
-
5$\begingroup$ According to imada.sdu.dk/~marco/DM825/Slides/dm825-lec7.pdf for example, it is a generic label for Linear DA + Quadratic DA. So, you may safely search/read (including this site) for just "discriminant analysis". It will correspond to GDA. GDA is DA assuming normally distributed population. $\endgroup$– ttnphnsCommented Dec 25, 2013 at 4:57
3 Answers
GDA, is a method for data classification commonly used when data can be approximated with a Normal distribution. As first step, you will need a training set, i.e. a bunch of data yet classified. These data are used to train your classifier, and obtain a discriminant function that will tell you to which class a data has higher probability to belong.
When you have your training set you need to compute the mean $\mu$ and the standard deviation $\sigma^2$. These two variables, as you know, allow you to describe a Normal distribution.
Once you have computed the Normal distribution for each class, to classify a data you will need to compute, for each one, the probability that that data belongs to it. The class with the highest probability will be chosen as the affinity class.
More information about Discriminant Functions for the Normal Density can be found in textbook as Pattern Classification DUDA, HART, SOTRK or Pattern Recognition and Machine Learning BISHOP.
-
$\begingroup$ The first book is by "Stork", not "Sotrk". $\endgroup$ Commented Apr 21, 2018 at 23:21
-
$\begingroup$ the tutorial links are broken, can you please check once again $\endgroup$ Commented Sep 30, 2018 at 12:11
-
I think Andrew Ng's notes on GDA (https://web.archive.org/web/20200103035702/http://cs229.stanford.edu/notes/cs229-notes2.pdf) are the best explanation I have seen of the concept, but I want to "try to explain this for someone at a high-school level" as requested (and relate it back to Andrew's notes for those of you who care for the math).
Imagine that you have two classes. Describe one class as $y=0$ and one class as $y=1$. Could be $apples$ vs $oranges$, for example.
You have a datapoint $x$ that describes an observation of one of these things. An observation could be, i.e., $[price, diameter, weight, color]$. It can be a collection of any attributes that can be measured, and you can measure as many things to describe an $x$ as you like. If we measure 4 different things to describe an $x$, then we say $x$ is 4 dimensional. In general we'll call this $d$.
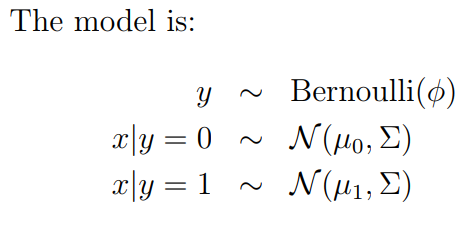
Here's the model of GDA from Andrew's notes:
In plain English this says:
$p(y)$ can be described as an unfair coin-flip. For example it might be that $p(y=0) = 0.4$ and $p(y=1) = 0.6$. I.e. there's a 40% chance that things are apples and 60% chance that things are oranges, period, out there in the world.
Given $y=0$ (i.e. if we can assume the thing is an apple), all the measurements in x are normally distributed with some set of parameters $\mu_0$ and $\Sigma$. $\mu_0$ is not one value - it is a $d$-dimensional vector. To define a normal distribution we need a $\mu$ for each dimension of x (mean price, mean weight, etc) and also a $d$x$d$ covariance matrix $\Sigma$ that describes how the dimensions relate to each other. Why? Because certain things might be correlated (i.e. large fruit probably weighs more).
We assume that if $y=1$ (the thing is an orange), its measurements behave normally as well. Except their means are different and we describe those with $\mu_1$. We use the same $\Sigma$ though.1
Ok...after all that setup, do a thought experiment:
Flip a unfair coin that determines if something is apple or orange. Then based on that result, go to Normal Distribution 0 or Normal Distribution 1, and sample a datapoint. If you repeat this many times you'll get a ton of datapoints in $d$-dimensional space. The distribution of this data, provided we have enough of it, will be "typical" of the specific model that we are generating from.
(hence why his note is called "Generative Learning algorithms")
But what if we do this backwards? I give you a bunch of data instead, and I tell you that it was generated in such a fashion. You could then, conversely, come back and tell me the probability on the coin, and the $\mu$s and $\Sigma$s of the two Normal distributions, that fit this data as best as possible. This backwards exercise is GDA.
1 Note that Andrew's model uses the same covariance matrix $\Sigma$ for both classes. This means that whatever my normal distribution looks like for one class - however tall/fat/slanty it is - I assume the other class' covariance matrix looks exactly like that as well.
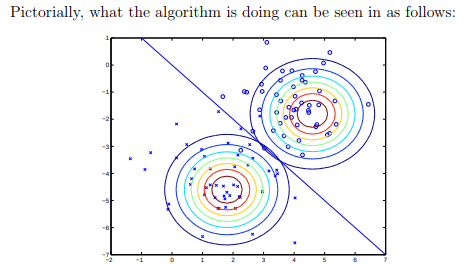
When $\Sigma$ is the same between classes, we have a special case of GDA called Linear Discriminant Analysis, because it results in a linear decision boundary (see pic below from Andrew's notes).
This assumption can certainly be false, and GDA describes this exercise in the most general case, when $\Sigma$s can be different between classes.
GDA is a form of linear distribution analysis. From a known $P(x|y)$, $$P(y|x) = \frac{P(x|y)P_{prior}(y)}{\Sigma_{g \in Y} P(x|g) P_{prior}(g) }$$
is derived through applying Bayes's.
It's basically, as @ttnphns noted, used usually as a generic label for any discriminant analysis that assumes a population that shows the Gaussian distribution. For a more in-depth explanation, read Fisher's 1936 paper in the Annals of Eugenics (yes, that's really what it was called). It's a hard and unrewarding read, but it is the source of the idea (a little warning: unlike wine, papers don't get better, and this one is very confusing to read when considering that it was written in a maths lingo that didn't use ideas like 'generative distribution analysis models', so there is a degree of terminological confusion here). I hereby shamefully admit that I am mostly self-taught, and my education on GDA has mainly been from a wonderful lecture (if that's your idea of fun) by Andrew Ng of Stanford that's well worth watching (and speaks about the subject in contemporary lingo).


