I have done some classification work using a k-nearest-neighbour classifier (kNN). And the classification performance is evaluated using cross-validation method. Some testing code from Matlab Help are
load ionosphere;
[N,D] = size(X)
resp = unique(Y)

rng(8000,'twister') % for reproducibility
K = round(logspace(0,log10(N),10)); % number of neighbors
cvloss = zeros(numel(K),1);
for k=1:numel(K)
    knn = ClassificationKNN.fit(X,Y,...
        'NumNeighbors',K(k),'CrossVal','On');
    cvloss(k) = kfoldLoss(knn);
end

figure; % Plot the accuracy versus k
semilogx(K,cvloss);
xlabel('Number of nearest neighbors');
ylabel('10 fold classification error');
title('k-NN classification');
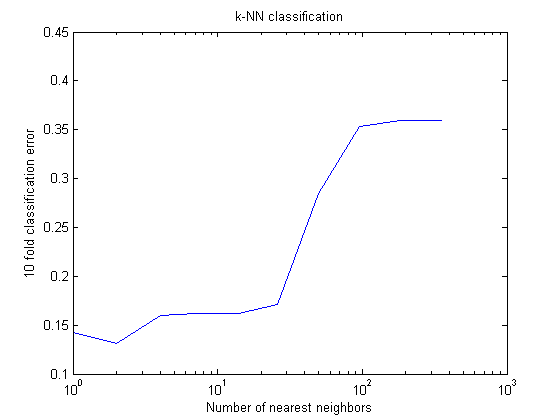
We can tune the number of k in kNN and plot with respect to the cross-validation error. In this case, the plot is like below

We can see that the plot shows a slightly larger error using very small value, e.g k=1. And the error goes down as we increase k and reaches the lowest error at k=2. And the error goes higher and higher and reaches some stable value after k>100.
My question is how to interpret the results?
- Why k is very small like k=1 we have slightly larger error?
- Why k is small we can obtain the best performance?
- Why when k is very large, we got very large error?
Please provide some reference if there are some mathematical background behind these. Thanks very much. A.
