17
$\begingroup$
                  Predicted
                    class
               Cat  Dog Rabbit
  Actual class
           Cat   5    3      0
           Dog   2    3      1
        Rabbit   0    2     11

How can I calculate precision and recall so It become easy to calculate F1-score. The normal confusion matrix is a 2 x 2 dimension. However, when it become 3 x 3 I don't know how to calculate precision and recall.

$\endgroup$
0

5 Answers 5

23
$\begingroup$

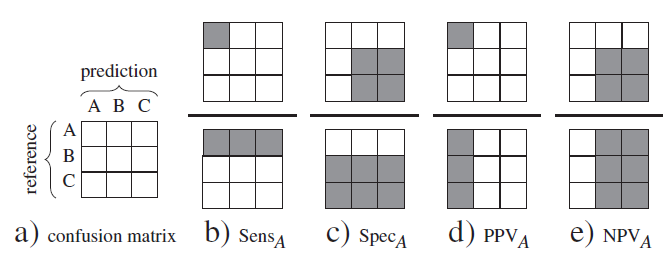
If you spell out the definitions of precision (aka positive predictive value PPV) and recall (aka sensitivity), you see that they relate to one class independent of any other classes:

Recall or senstitivity is the proportion of cases correctly identified as belonging to class c among all cases that truly belong to class c.
(Given we have a case truly belonging to "c", what is the probability of predicting this correctly?)

Precision or positive predictive value PPV is the proportion of cases correctly identified as belonging to class c among all cases of which the classifier claims that they belong to class c.
In other words, of those cases predicted to belong to class c, which fraction truly belongs to class c? (Given the predicion "c", what is the probability of being correct?)

negative predictive value NPV of those cases predicted not to belong to class c, which fraction truly doesn't belong to class c? (Given the predicion "not c", what is the probability of being correct?)

So you can calculate precision and recall for each of your classes. For multi-class confusion tables, that's the diagonal elements divided by their row and column sums, respectively:

calculation scheme

Source: Beleites, C.; Salzer, R. & Sergo, V. Validation of soft classification models using partial class memberships: An extended concept of sensitivity & co. applied to grading of astrocytoma tissues, Chemom Intell Lab Syst, 122, 12 - 22 (2013). DOI: 10.1016/j.chemolab.2012.12.003

$\endgroup$
1
  • $\begingroup$ Thanks so much. I already understand the analogy described in your solution. I will read paper. I will accept this as a answer. I don't understand PPV AND NPV.Please explain these concept as graphic as the Sens and Spec were explained and I will accept your answer. $\endgroup$
    – user22149
    Commented Mar 23, 2014 at 22:27
3
$\begingroup$

By reducing the data down to forced choices (classification) and not recording whether any were "close calls", you obtain minimum-information minimum-precision statistical estimates, in addition to secretly assuming a strange utility/loss/cost function and using arbitrary thresholds. It would be far better to use maximum information, which would include the probabilities of class membership and not forced choices.

$\endgroup$
1
$\begingroup$

The easiest way is to not use confusion_matrix at all, Use classification_report(), it will give you everything you ever needed, cheers...

Edit:
this is the format for confusion_matrix():
[[TP,FN]
[FP,TN]]
And classification report gives all this

$\endgroup$
1
  • $\begingroup$ That if you are using python/// $\endgroup$
    – omkaartg
    Commented Jul 27, 2018 at 12:23
1
$\begingroup$

Following is an example of a multi-class confusion matrix assuming our class labels are A, B and C

A/P         A        B       C       Sum
A           10       3        4       17
B           2       12        6       20
C           6        3         9       18

Sum      18     18       19       55

Now we calculate three values for Precision and Recall each and call them Pa, Pb and Pc; and similarly Ra, Rb, Rc.

We know Precision = TP/(TP+FP), so for Pa true positive will be Actual A predicted as A, i.e., 10, rest of the two cells in that column, whether it is B or C, make False Positive. So

Pa = 10/18 = 0.55 Ra = 10/17 = 0.59

Now precision and recall for class B are Pb and Rb. For class B, true positive is actual B predicted as B, that is the cell containing the value 12 and rest of the two cells in that column make False Positive, so

Pb = 12/18 = 0.67 Rb = 12/20 = 0.6

Similarly Pc = 9/19 = 0.47 Rc = 9/18 = 0.5

The overall performance of the classifier will be determined by average Precision and Average Recall. For this we multiply precision value for each class with the actual number of instances for that class, then add them and divide them with total number of instances. Like ,

Avg Precision = (0.55* 17 + 0.67 * 20 + 0.47 * 18)/55 = 31.21/55 = 0.57 Avg Recall = (0.59* 17 + 0.6 * 20 + 0.5 * 18)/55 = 31.03/55 = 0.56

I hope it helps

$\endgroup$
0
$\begingroup$

If you simply want the result, my advice would be to not think too much about and use the tools at your disposal. Here is how you can do it in Python;

import pandas as pd
from sklearn.metrics import classification_report

results = pd.DataFrame(
    [[1, 1],
     [1, 2],
     [1, 3],
     [2, 1],
     [2, 2],
     [2, 3],
     [3, 1],
     [3, 2],
     [3, 3]], columns=['Expected', 'Predicted'])

print(results)
print()
print(classification_report(results['Expected'], results['Predicted']))

To get the following output

   Expected  Predicted
0         1          1
1         1          2
2         1          3
3         2          1
4         2          2
5         2          3
6         3          1
7         3          2
8         3          3

             precision    recall  f1-score   support

          1       0.33      0.33      0.33         3
          2       0.33      0.33      0.33         3
          3       0.33      0.33      0.33         3

avg / total       0.33      0.33      0.33         9
$\endgroup$

Your Answer

By clicking “Post Your Answer”, you agree to our terms of service and acknowledge you have read our privacy policy.

Not the answer you're looking for? Browse other questions tagged or ask your own question.