What effect does sample size have on adjusted R squared values?
2 Answers
Adjusted r-squared is intended to be an unbiased estimate of population variance explained using the population regression equation. There are several different formulas for adjusted r-squared and there are various definitions of population variance explained (e.g., fixed versus random-x assumptions). Most commonly, statistical software will report the Ezekiel formula which makes the fixed-x assumption.
In general, as sample size increases,
- the difference between expected adjusted r-squared and expected r-squared approaches zero; in theory this is because expected r-squared becomes less biased.
- the standard error of adjusted r-squared would get smaller approaching zero in the limit.
So the main take-home message is that if you are interested in population variance explained, then adjusted r-squared is always a better option than r-squared. That said, as your sample size gets very large, r-squared won't be that biased (note that for models with large numbers of predictors, sample size needs to be even bigger for r-squared to approach being unbiased).
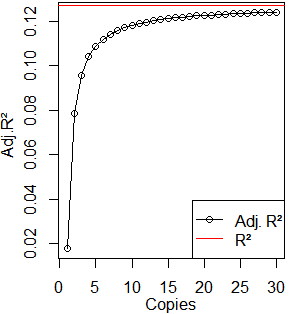
Here's a simple function in R that simulates two Gaussian variables and copies them to inflate sample size without changing their correlation. It plots adjusted $R^2$ over increasing copies with a line at $R^2$.
Adj.R.Squared=function(Sample.Size=10,Max.Copies=30,Noise=1){Adj.R²=c();y=rnorm(Sample.Size)
x=y+Noise*rnorm(Sample.Size);Copies=1:Max.Copies;for(i in 1:Max.Copies)
{Adj.R²=append(Adj.R²,summary(lm(rep(y,i)~rep(x,i)))$adj.r.squared)}
plot(Copies,Adj.R²);abline(h=summary(lm(y~x))$r.squared,col='red');lines(Copies,Adj.R²)
legend('bottomright',c('Adj. R²','R²'),lty=1,col=c('black','red'),pch=c(1,NA))}
It generates new data every time you run it, but always takes on more or less the same shape, asymptotically approaching $R^2$ like @JeromyAnglim described. For example, with set.seed(1):

Decreasing Noise (which increases $R^2$) will shrink the scale of the $y$ axis but not alter the shape: i.e., the difference between adjusted $R^2$ and $R^2$ decreases as $R^2$ increases, but doesn't change the effect of sample size. Increasing Sample.Size makes adjusted $R^2$ approach $R^2$ a little more slowly, but mostly shrinks the scale of the $y$ axis. You can increase Max.Copies to extend the $x$ axis, or modify this function to work with manually entered data or multiple predictors. I've done this myself but not included the code because it doesn't seem to change the basic conclusion. This is intended as a maximally simple answer to a very simple question. Therefore its generalizability may be limited.
