The Weibull distribution (or Weibull probability density function - pdf) with two parameters has the shape parameter ($k$) and the scale parameter ($\lambda$).
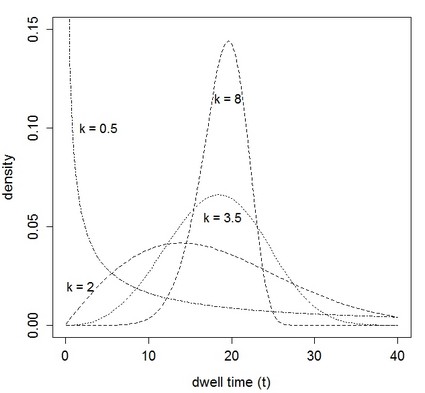
The shape parameter models the format (shape) of the distribution. If $k$ = 1 the Weibull distribution reduces to an exponential distribution. If $k$ is between 3 and 4, the Weibull pdf is similar to a normal distribution. See the following picture, which simulates a Weibull pdf with a fixed scale parameter ($\lambda$ = 20) and varies the shape parameter ($k$) from 0.5 to 2, 3.5 and 8:

In the study of Liu et al. (2010), the authors fitted 205,873 Weibull distributions (one for each of the 205,873 URLs investigated) using dwell time data.
The picture 3b is an empirical cumulative density function (eCDF) regarding the shape parameter for all the 205,873 Weibull pdfs obtained. That figure shows that in 98.5% of these 205,873 Weibull distributions, the shape parameter ($k$) was smaller than 1. This means that the dwell time frequency drops exponentially.
This is not my area of expertise, but if understood a little bit about that article, the authors explain this behavior claiming that the first thing a user does in a web page is to scroll it down to see if there is something interesting there. In this phase there is a huge frequency (or probability density) of users abandoning the website. If the webpage survives this phase of screening, than the dwell time behavior will be more smooth (makes sense to me).
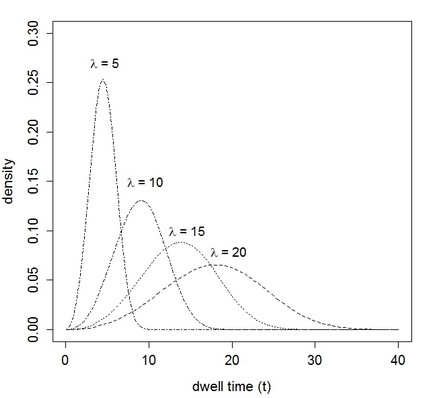
The Weibull scale parameter ($\lambda$) is the 63.2 percentile of the distribution (McCool, 2012). This means that if, for example, given a Weibull distribution with $\lambda$ = 2, 63.2% of the observed values will be smaller than 2. The following picture shows how the scale parameter varies, holding the shape parameter constant ($k$ = 3.5).

In the Liu et al. (2010) picture 3a, they show that 80% of the 205,873 fitted Weibull pdfs, had the scale parameter smaller than 70 seconds. This means that in those 80% URLs the dwell time value was smaller than 70 seconds in 63.2% of all observations.
I hope this can help you start understanding the Weibull pdf parameters.
References
McCool, J.I. Using the Weibull Distribution: Reliability, Modeling and Inference. Hoboken: John Wiley., 2012. 368p.
Liu, C.; White, R. W.; Dumais, S. Understanding Web Browsing Behaviors through
Weibull Analysis of Dwell Time. SIGIR’10. Geneva, Switzerland. 2010.
Code in R, to reproduce pictures in this answer.
require(MASS)

# Weibull shape
windows()
i=0.5
set.seed(29)
x=rweibull(1000,shape=i,scale=20)
weib = fitdistr(na.omit(x),densfun=dweibull,start=list(scale=1,shape=1))
plot(curve(dweibull(x,shape=weib$estimate[2],scale=weib$estimate[1]),from=0.1,to=40),ylim=c(0,0.15),type="l",lty=4, xlab="dwell time (t)",ylab = "density", cex.lab=1.35, cex.axis=1.25)
rm(x,weib,i)

for (i in c(2,3.5,8)){
x=rweibull(1000,shape=i,scale=20)
weib = fitdistr(na.omit(x),densfun=dweibull,start=list(scale=1,shape=1))
curve(dweibull(x,shape=weib$estimate[2],scale=weib$estimate[1]),from=0.1,to=40,lty=i, add=T)
rm(i,x,weib)
}

text(4,0.1,expression(paste("k = 0.5")),cex=1.15)
text(1.85,0.02,expression(paste("k = 2")),cex=1.15)
text(18.95,0.055,expression(paste("k = 3.5")),cex=1.15)
text(19.6,0.115,expression(paste("k = 8")),cex=1.15)

dev.off()

# Weibull scale
windows()
i=5
set.seed(29)
x=rweibull(1000,shape=3.5,scale=i)
weib = fitdistr(na.omit(x),densfun=dweibull,start=list(scale=1,shape=1))
plot(curve(dweibull(x,shape=weib$estimate[2],scale=weib$estimate[1]),from=0.1,to=40),ylim=c(0,0.3),type="l",lty=4, xlab="dwell time (t)",ylab = "density", cex.lab=1.35, cex.axis=1.25)
rm(x,weib,i)

for (i in c(10,15,20)){
x=rweibull(1000,shape=3.5,scale=i)
weib = fitdistr(na.omit(x),densfun=dweibull,start=list(scale=1,shape=1))
curve(dweibull(x,shape=weib$estimate[2],scale=weib$estimate[1]),from=0.1,to=40,lty=i, add=T)
rm(i,x,weib)
}

text(4.75,0.27,expression(paste(lambda," = 5")),cex=1.15)
text(9.62,0.15,expression(paste(lambda," = 10")),cex=1.15)
text(14.65,0.1,expression(paste(lambda," = 15")),cex=1.15)
text(19.65,0.079,expression(paste(lambda," = 20")),cex=1.15)

dev.off()


